Slavic vs Immigrants from Senegal Unemployment Among Ages 35 to 44 years
COMPARE
Slavic
Immigrants from Senegal
Unemployment Among Ages 35 to 44 years
Unemployment Among Ages 35 to 44 years Comparison
Slavs
Immigrants from Senegal
4.6%
UNEMPLOYMENT AMONG AGES 35 TO 44 YEARS
72.4/ 100
METRIC RATING
148th/ 347
METRIC RANK
5.4%
UNEMPLOYMENT AMONG AGES 35 TO 44 YEARS
0.0/ 100
METRIC RATING
279th/ 347
METRIC RANK
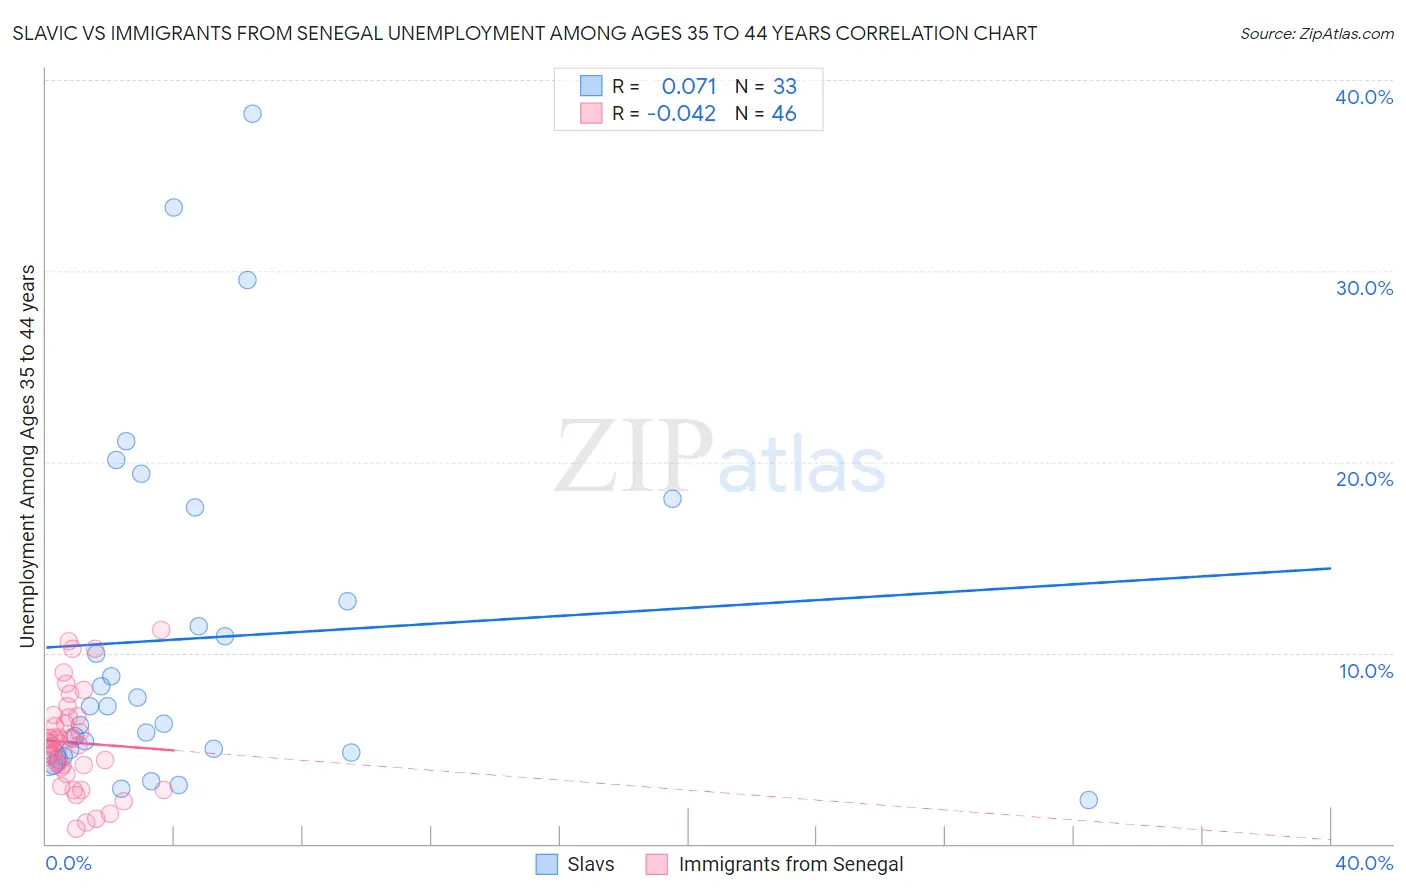
Slavic vs Immigrants from Senegal Unemployment Among Ages 35 to 44 years Correlation Chart
The statistical analysis conducted on geographies consisting of 265,902,983 people shows a slight positive correlation between the proportion of Slavs and unemployment rate among population between the ages 35 and 44 in the United States with a correlation coefficient (R) of 0.071 and weighted average of 4.6%. Similarly, the statistical analysis conducted on geographies consisting of 89,848,104 people shows no correlation between the proportion of Immigrants from Senegal and unemployment rate among population between the ages 35 and 44 in the United States with a correlation coefficient (R) of -0.042 and weighted average of 5.4%, a difference of 16.8%.
Unemployment Among Ages 35 to 44 years Correlation Summary
| Measurement | Slavic | Immigrants from Senegal |
| Minimum | 2.3% | 0.80% |
| Maximum | 38.2% | 11.2% |
| Range | 35.9% | 10.4% |
| Mean | 10.7% | 5.3% |
| Median | 7.2% | 5.2% |
| Interquartile 25% (IQ1) | 4.7% | 4.0% |
| Interquartile 75% (IQ3) | 15.1% | 6.6% |
| Interquartile Range (IQR) | 10.4% | 2.6% |
| Standard Deviation (Sample) | 9.1% | 2.5% |
| Standard Deviation (Population) | 9.0% | 2.5% |
Similar Demographics by Unemployment Among Ages 35 to 44 years
Demographics Similar to Slavs by Unemployment Among Ages 35 to 44 years
In terms of unemployment among ages 35 to 44 years, the demographic groups most similar to Slavs are Immigrants from Burma/Myanmar (4.6%, a difference of 0.020%), Immigrants from Vietnam (4.6%, a difference of 0.12%), Immigrants from England (4.6%, a difference of 0.17%), Immigrants from Denmark (4.6%, a difference of 0.18%), and Immigrants from Eastern Europe (4.6%, a difference of 0.20%).
| Demographics | Rating | Rank | Unemployment Among Ages 35 to 44 years |
| Canadians | 75.9 /100 | #141 | Good 4.6% |
| Ukrainians | 75.8 /100 | #142 | Good 4.6% |
| Immigrants | Switzerland | 75.5 /100 | #143 | Good 4.6% |
| Immigrants | Russia | 75.4 /100 | #144 | Good 4.6% |
| Immigrants | Eastern Europe | 74.7 /100 | #145 | Good 4.6% |
| Immigrants | Denmark | 74.4 /100 | #146 | Good 4.6% |
| Immigrants | Vietnam | 73.8 /100 | #147 | Good 4.6% |
| Slavs | 72.4 /100 | #148 | Good 4.6% |
| Immigrants | Burma/Myanmar | 72.2 /100 | #149 | Good 4.6% |
| Immigrants | England | 70.5 /100 | #150 | Good 4.6% |
| Puget Sound Salish | 67.1 /100 | #151 | Good 4.6% |
| Pakistanis | 67.1 /100 | #152 | Good 4.6% |
| Immigrants | Brazil | 67.0 /100 | #153 | Good 4.6% |
| Immigrants | Western Europe | 65.5 /100 | #154 | Good 4.6% |
| Whites/Caucasians | 64.9 /100 | #155 | Good 4.6% |
Demographics Similar to Immigrants from Senegal by Unemployment Among Ages 35 to 44 years
In terms of unemployment among ages 35 to 44 years, the demographic groups most similar to Immigrants from Senegal are Lumbee (5.4%, a difference of 0.060%), Ecuadorian (5.4%, a difference of 0.17%), Immigrants from Portugal (5.4%, a difference of 0.21%), Immigrants from Caribbean (5.4%, a difference of 0.29%), and Native Hawaiian (5.4%, a difference of 0.36%).
| Demographics | Rating | Rank | Unemployment Among Ages 35 to 44 years |
| Senegalese | 0.0 /100 | #272 | Tragic 5.3% |
| Vietnamese | 0.0 /100 | #273 | Tragic 5.4% |
| Creek | 0.0 /100 | #274 | Tragic 5.4% |
| Immigrants | Mexico | 0.0 /100 | #275 | Tragic 5.4% |
| Native Hawaiians | 0.0 /100 | #276 | Tragic 5.4% |
| Immigrants | Caribbean | 0.0 /100 | #277 | Tragic 5.4% |
| Lumbee | 0.0 /100 | #278 | Tragic 5.4% |
| Immigrants | Senegal | 0.0 /100 | #279 | Tragic 5.4% |
| Ecuadorians | 0.0 /100 | #280 | Tragic 5.4% |
| Immigrants | Portugal | 0.0 /100 | #281 | Tragic 5.4% |
| Immigrants | Ghana | 0.0 /100 | #282 | Tragic 5.4% |
| Immigrants | Ecuador | 0.0 /100 | #283 | Tragic 5.4% |
| Haitians | 0.0 /100 | #284 | Tragic 5.5% |
| Hispanics or Latinos | 0.0 /100 | #285 | Tragic 5.5% |
| Immigrants | Micronesia | 0.0 /100 | #286 | Tragic 5.5% |