Immigrants from Uruguay vs Pakistani Child Poverty Under the Age of 16
COMPARE
Immigrants from Uruguay
Pakistani
Child Poverty Under the Age of 16
Child Poverty Under the Age of 16 Comparison
Immigrants from Uruguay
Pakistanis
16.8%
CHILD POVERTY UNDER THE AGE OF 16
23.1/ 100
METRIC RATING
194th/ 347
METRIC RANK
15.0%
CHILD POVERTY UNDER THE AGE OF 16
91.7/ 100
METRIC RATING
122nd/ 347
METRIC RANK
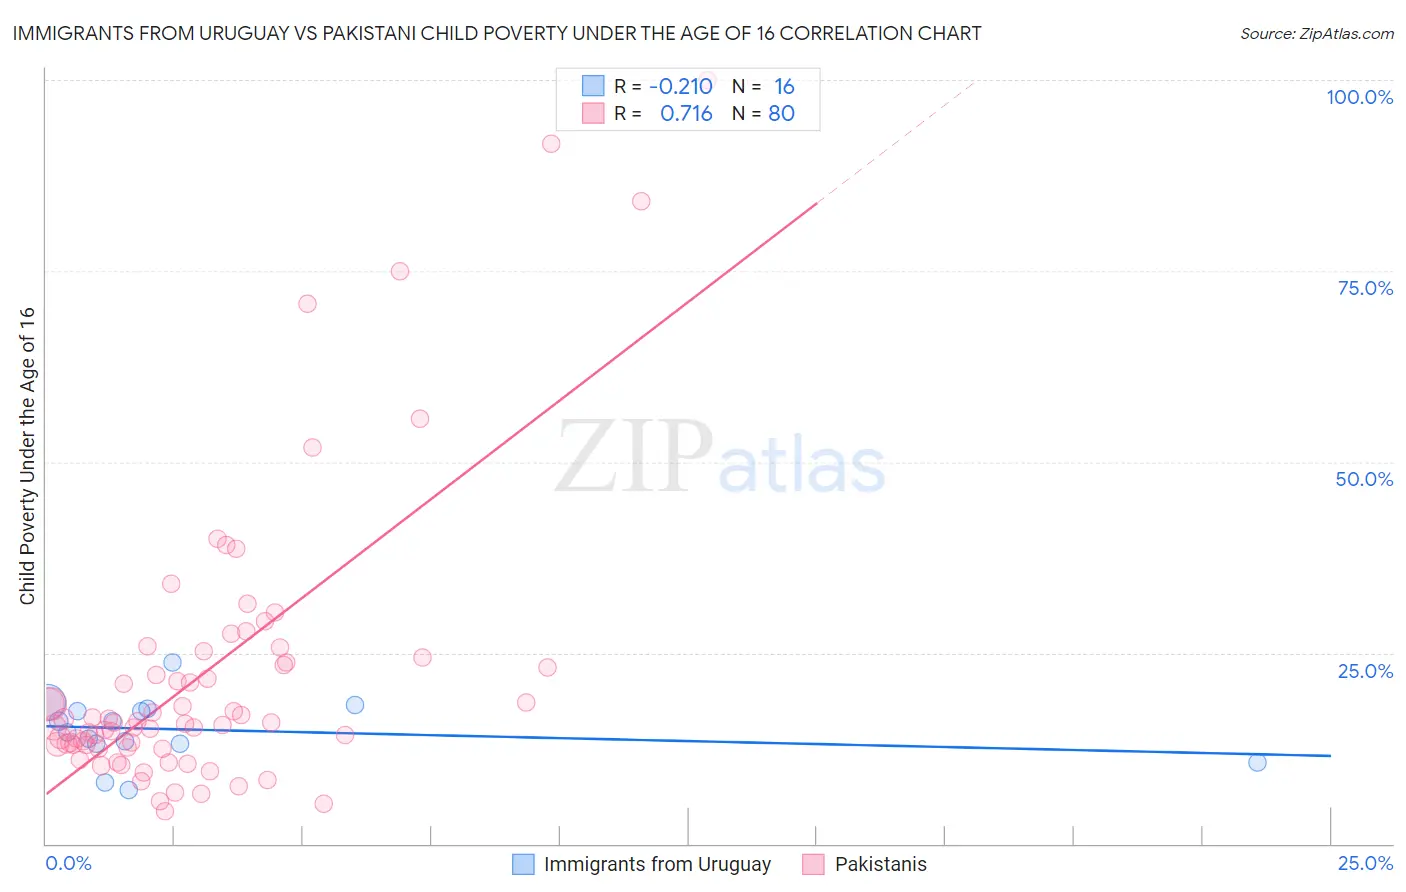
Immigrants from Uruguay vs Pakistani Child Poverty Under the Age of 16 Correlation Chart
The statistical analysis conducted on geographies consisting of 132,929,464 people shows a weak negative correlation between the proportion of Immigrants from Uruguay and poverty level among children under the age of 16 in the United States with a correlation coefficient (R) of -0.210 and weighted average of 16.8%. Similarly, the statistical analysis conducted on geographies consisting of 333,364,420 people shows a strong positive correlation between the proportion of Pakistanis and poverty level among children under the age of 16 in the United States with a correlation coefficient (R) of 0.716 and weighted average of 15.0%, a difference of 11.6%.
Child Poverty Under the Age of 16 Correlation Summary
| Measurement | Immigrants from Uruguay | Pakistani |
| Minimum | 7.0% | 4.3% |
| Maximum | 23.8% | 100.0% |
| Range | 16.8% | 95.7% |
| Mean | 14.9% | 22.3% |
| Median | 15.3% | 15.8% |
| Interquartile 25% (IQ1) | 13.1% | 12.9% |
| Interquartile 75% (IQ3) | 17.6% | 24.0% |
| Interquartile Range (IQR) | 4.5% | 11.1% |
| Standard Deviation (Sample) | 4.2% | 18.9% |
| Standard Deviation (Population) | 4.1% | 18.8% |
Similar Demographics by Child Poverty Under the Age of 16
Demographics Similar to Immigrants from Uruguay by Child Poverty Under the Age of 16
In terms of child poverty under the age of 16, the demographic groups most similar to Immigrants from Uruguay are Spaniard (16.8%, a difference of 0.020%), Immigrants from Uganda (16.8%, a difference of 0.090%), Immigrants from Lebanon (16.8%, a difference of 0.17%), Spanish (16.7%, a difference of 0.22%), and Immigrants from Kenya (16.9%, a difference of 0.69%).
| Demographics | Rating | Rank | Child Poverty Under the Age of 16 |
| Arabs | 31.4 /100 | #187 | Fair 16.6% |
| Immigrants | Morocco | 31.2 /100 | #188 | Fair 16.6% |
| Immigrants | Portugal | 30.0 /100 | #189 | Fair 16.6% |
| Immigrants | Costa Rica | 29.6 /100 | #190 | Fair 16.6% |
| Immigrants | Iraq | 28.3 /100 | #191 | Fair 16.7% |
| Spanish | 24.5 /100 | #192 | Fair 16.7% |
| Spaniards | 23.2 /100 | #193 | Fair 16.8% |
| Immigrants | Uruguay | 23.1 /100 | #194 | Fair 16.8% |
| Immigrants | Uganda | 22.5 /100 | #195 | Fair 16.8% |
| Immigrants | Lebanon | 22.0 /100 | #196 | Fair 16.8% |
| Immigrants | Kenya | 19.1 /100 | #197 | Poor 16.9% |
| Delaware | 17.1 /100 | #198 | Poor 17.0% |
| Immigrants | Afghanistan | 15.1 /100 | #199 | Poor 17.0% |
| Immigrants | Cameroon | 14.7 /100 | #200 | Poor 17.1% |
| Immigrants | Uzbekistan | 14.7 /100 | #201 | Poor 17.1% |
Demographics Similar to Pakistanis by Child Poverty Under the Age of 16
In terms of child poverty under the age of 16, the demographic groups most similar to Pakistanis are South African (15.0%, a difference of 0.20%), Immigrants from Zimbabwe (15.0%, a difference of 0.20%), Immigrants from Brazil (15.1%, a difference of 0.24%), Czechoslovakian (15.1%, a difference of 0.25%), and Scottish (15.0%, a difference of 0.29%).
| Demographics | Rating | Rank | Child Poverty Under the Age of 16 |
| Immigrants | Ukraine | 93.1 /100 | #115 | Exceptional 14.9% |
| Carpatho Rusyns | 93.1 /100 | #116 | Exceptional 14.9% |
| Immigrants | Norway | 92.8 /100 | #117 | Exceptional 15.0% |
| Immigrants | Malaysia | 92.6 /100 | #118 | Exceptional 15.0% |
| Scottish | 92.3 /100 | #119 | Exceptional 15.0% |
| South Africans | 92.1 /100 | #120 | Exceptional 15.0% |
| Immigrants | Zimbabwe | 92.1 /100 | #121 | Exceptional 15.0% |
| Pakistanis | 91.7 /100 | #122 | Exceptional 15.0% |
| Immigrants | Brazil | 91.1 /100 | #123 | Exceptional 15.1% |
| Czechoslovakians | 91.0 /100 | #124 | Exceptional 15.1% |
| Palestinians | 90.9 /100 | #125 | Exceptional 15.1% |
| Portuguese | 90.6 /100 | #126 | Exceptional 15.1% |
| Immigrants | Western Europe | 90.3 /100 | #127 | Exceptional 15.1% |
| Immigrants | Kazakhstan | 90.2 /100 | #128 | Exceptional 15.1% |
| Immigrants | Southern Europe | 89.7 /100 | #129 | Excellent 15.1% |