Yup'ik vs Pueblo Single Mother Poverty
COMPARE
Yup'ik
Pueblo
Single Mother Poverty
Single Mother Poverty Comparison
Yup'ik
Pueblo
32.5%
SINGLE MOTHER POVERTY
0.0/ 100
METRIC RATING
286th/ 347
METRIC RANK
37.2%
SINGLE MOTHER POVERTY
0.0/ 100
METRIC RATING
334th/ 347
METRIC RANK
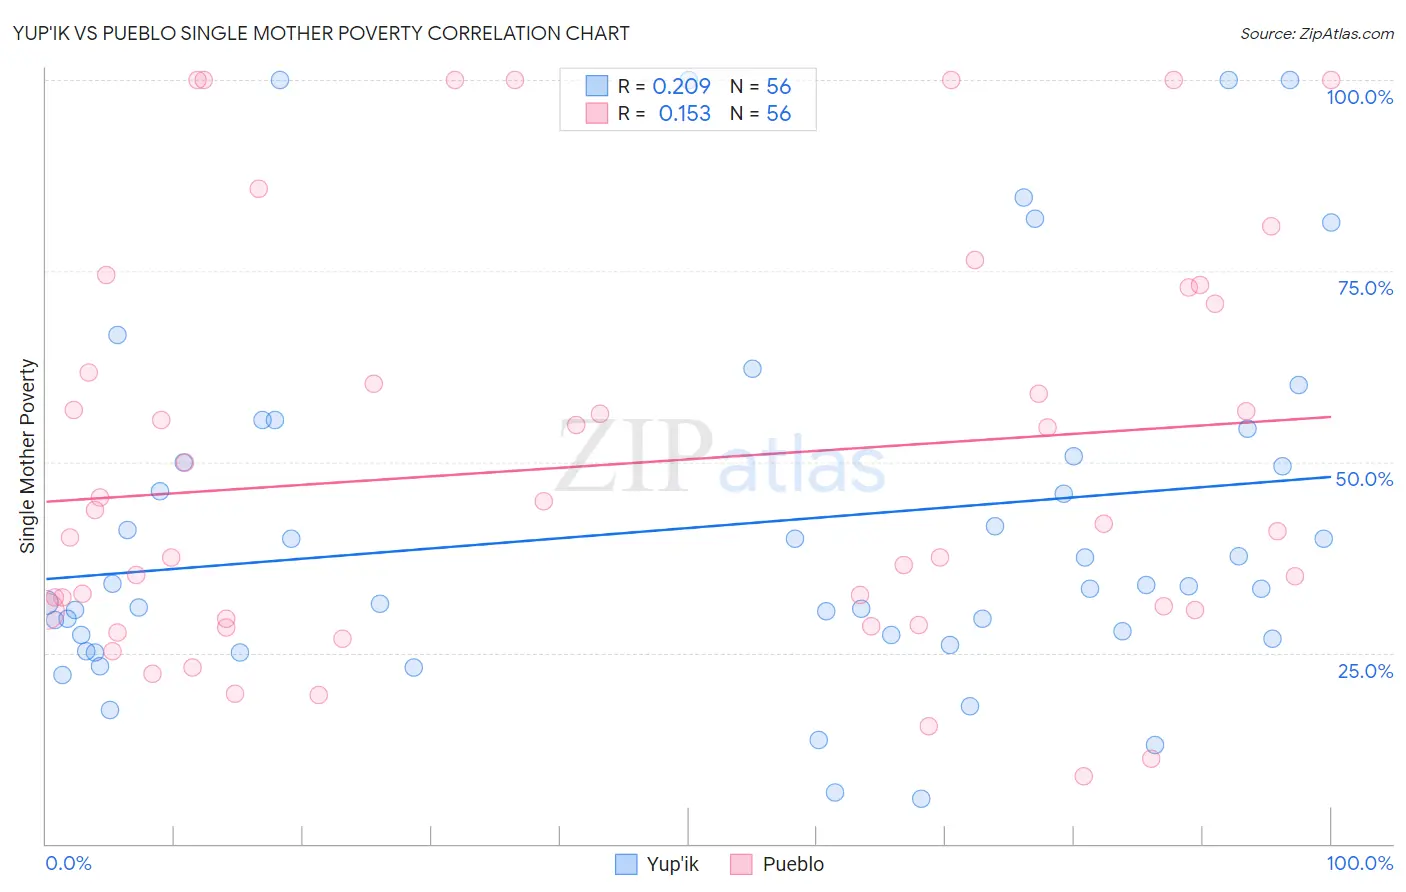
Yup'ik vs Pueblo Single Mother Poverty Correlation Chart
The statistical analysis conducted on geographies consisting of 39,732,342 people shows a weak positive correlation between the proportion of Yup'ik and poverty level among single mothers in the United States with a correlation coefficient (R) of 0.209 and weighted average of 32.5%. Similarly, the statistical analysis conducted on geographies consisting of 119,257,256 people shows a poor positive correlation between the proportion of Pueblo and poverty level among single mothers in the United States with a correlation coefficient (R) of 0.153 and weighted average of 37.2%, a difference of 14.6%.
Single Mother Poverty Correlation Summary
| Measurement | Yup'ik | Pueblo |
| Minimum | 5.9% | 8.8% |
| Maximum | 100.0% | 100.0% |
| Range | 94.1% | 91.2% |
| Mean | 41.4% | 49.5% |
| Median | 33.5% | 41.4% |
| Interquartile 25% (IQ1) | 27.1% | 30.0% |
| Interquartile 75% (IQ3) | 50.3% | 66.2% |
| Interquartile Range (IQR) | 23.3% | 36.2% |
| Standard Deviation (Sample) | 23.6% | 26.2% |
| Standard Deviation (Population) | 23.4% | 26.0% |
Similar Demographics by Single Mother Poverty
Demographics Similar to Yup'ik by Single Mother Poverty
In terms of single mother poverty, the demographic groups most similar to Yup'ik are Immigrants from Latin America (32.4%, a difference of 0.070%), Immigrants from Dominica (32.5%, a difference of 0.13%), Indonesian (32.4%, a difference of 0.19%), Somali (32.6%, a difference of 0.35%), and U.S. Virgin Islander (32.6%, a difference of 0.38%).
| Demographics | Rating | Rank | Single Mother Poverty |
| Marshallese | 0.0 /100 | #279 | Tragic 32.1% |
| Immigrants | Nonimmigrants | 0.0 /100 | #280 | Tragic 32.2% |
| Cree | 0.0 /100 | #281 | Tragic 32.2% |
| Immigrants | Azores | 0.0 /100 | #282 | Tragic 32.2% |
| Spanish Americans | 0.0 /100 | #283 | Tragic 32.3% |
| Indonesians | 0.0 /100 | #284 | Tragic 32.4% |
| Immigrants | Latin America | 0.0 /100 | #285 | Tragic 32.4% |
| Yup'ik | 0.0 /100 | #286 | Tragic 32.5% |
| Immigrants | Dominica | 0.0 /100 | #287 | Tragic 32.5% |
| Somalis | 0.0 /100 | #288 | Tragic 32.6% |
| U.S. Virgin Islanders | 0.0 /100 | #289 | Tragic 32.6% |
| Osage | 0.0 /100 | #290 | Tragic 32.6% |
| Guatemalans | 0.0 /100 | #291 | Tragic 32.9% |
| Shoshone | 0.0 /100 | #292 | Tragic 32.9% |
| Aleuts | 0.0 /100 | #293 | Tragic 32.9% |
Demographics Similar to Pueblo by Single Mother Poverty
In terms of single mother poverty, the demographic groups most similar to Pueblo are Menominee (37.1%, a difference of 0.37%), Dutch West Indian (36.8%, a difference of 1.2%), Creek (36.7%, a difference of 1.4%), Yuman (37.8%, a difference of 1.5%), and Native/Alaskan (36.6%, a difference of 1.6%).
| Demographics | Rating | Rank | Single Mother Poverty |
| Yakama | 0.0 /100 | #327 | Tragic 36.4% |
| Choctaw | 0.0 /100 | #328 | Tragic 36.4% |
| Apache | 0.0 /100 | #329 | Tragic 36.6% |
| Natives/Alaskans | 0.0 /100 | #330 | Tragic 36.6% |
| Creek | 0.0 /100 | #331 | Tragic 36.7% |
| Dutch West Indians | 0.0 /100 | #332 | Tragic 36.8% |
| Menominee | 0.0 /100 | #333 | Tragic 37.1% |
| Pueblo | 0.0 /100 | #334 | Tragic 37.2% |
| Yuman | 0.0 /100 | #335 | Tragic 37.8% |
| Cheyenne | 0.0 /100 | #336 | Tragic 38.5% |
| Immigrants | Yemen | 0.0 /100 | #337 | Tragic 38.5% |
| Pima | 0.0 /100 | #338 | Tragic 38.6% |
| Crow | 0.0 /100 | #339 | Tragic 38.6% |
| Sioux | 0.0 /100 | #340 | Tragic 38.8% |
| Colville | 0.0 /100 | #341 | Tragic 39.3% |