Puget Sound Salish vs Immigrants from Uzbekistan Child Poverty Among Boys Under 16
COMPARE
Puget Sound Salish
Immigrants from Uzbekistan
Child Poverty Among Boys Under 16
Child Poverty Among Boys Under 16 Comparison
Puget Sound Salish
Immigrants from Uzbekistan
15.8%
CHILD POVERTY AMONG BOYS UNDER 16
79.8/ 100
METRIC RATING
151st/ 347
METRIC RANK
17.3%
CHILD POVERTY AMONG BOYS UNDER 16
13.3/ 100
METRIC RATING
203rd/ 347
METRIC RANK
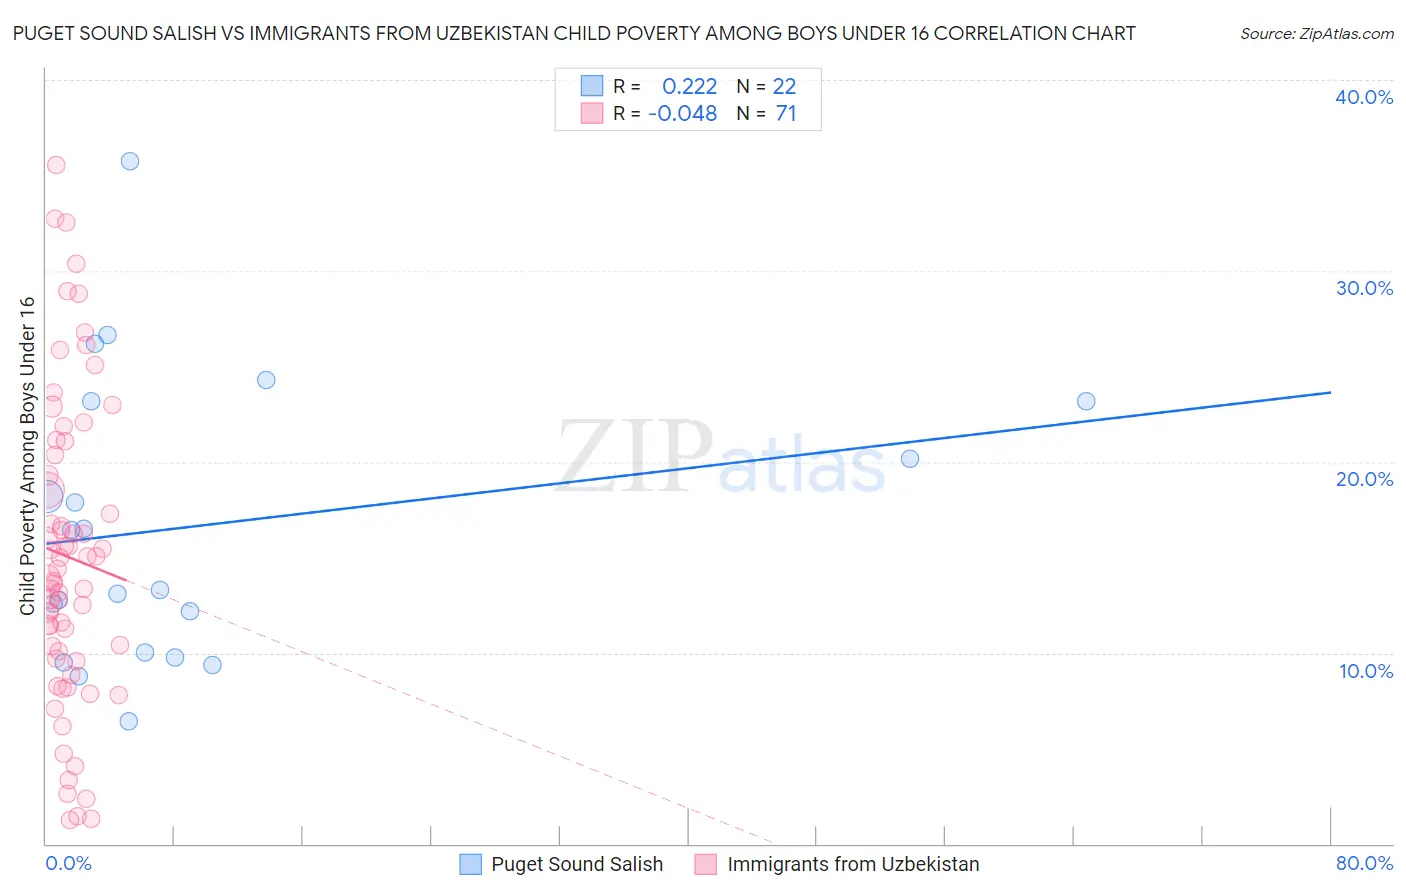
Puget Sound Salish vs Immigrants from Uzbekistan Child Poverty Among Boys Under 16 Correlation Chart
The statistical analysis conducted on geographies consisting of 45,876,308 people shows a weak positive correlation between the proportion of Puget Sound Salish and poverty level among boys under the age of 16 in the United States with a correlation coefficient (R) of 0.222 and weighted average of 15.8%. Similarly, the statistical analysis conducted on geographies consisting of 117,928,505 people shows no correlation between the proportion of Immigrants from Uzbekistan and poverty level among boys under the age of 16 in the United States with a correlation coefficient (R) of -0.048 and weighted average of 17.3%, a difference of 9.4%.
Child Poverty Among Boys Under 16 Correlation Summary
| Measurement | Puget Sound Salish | Immigrants from Uzbekistan |
| Minimum | 6.4% | 1.3% |
| Maximum | 35.8% | 35.6% |
| Range | 29.3% | 34.3% |
| Mean | 16.6% | 15.0% |
| Median | 14.8% | 14.0% |
| Interquartile 25% (IQ1) | 10.0% | 9.7% |
| Interquartile 75% (IQ3) | 23.2% | 20.3% |
| Interquartile Range (IQR) | 13.2% | 10.7% |
| Standard Deviation (Sample) | 7.4% | 8.0% |
| Standard Deviation (Population) | 7.2% | 7.9% |
Similar Demographics by Child Poverty Among Boys Under 16
Demographics Similar to Puget Sound Salish by Child Poverty Among Boys Under 16
In terms of child poverty among boys under 16, the demographic groups most similar to Puget Sound Salish are Immigrants from Venezuela (15.8%, a difference of 0.050%), Immigrants from Jordan (15.8%, a difference of 0.080%), Slovak (15.8%, a difference of 0.090%), French (15.8%, a difference of 0.19%), and Brazilian (15.8%, a difference of 0.23%).
| Demographics | Rating | Rank | Child Poverty Among Boys Under 16 |
| Immigrants | Peru | 83.5 /100 | #144 | Excellent 15.7% |
| Samoans | 83.2 /100 | #145 | Excellent 15.7% |
| New Zealanders | 82.4 /100 | #146 | Excellent 15.7% |
| Venezuelans | 82.1 /100 | #147 | Excellent 15.7% |
| Brazilians | 81.0 /100 | #148 | Excellent 15.8% |
| Slovaks | 80.3 /100 | #149 | Excellent 15.8% |
| Immigrants | Jordan | 80.2 /100 | #150 | Excellent 15.8% |
| Puget Sound Salish | 79.8 /100 | #151 | Good 15.8% |
| Immigrants | Venezuela | 79.5 /100 | #152 | Good 15.8% |
| French | 78.7 /100 | #153 | Good 15.8% |
| Syrians | 77.5 /100 | #154 | Good 15.9% |
| French Canadians | 76.6 /100 | #155 | Good 15.9% |
| Israelis | 76.5 /100 | #156 | Good 15.9% |
| Immigrants | Nepal | 76.0 /100 | #157 | Good 15.9% |
| Yugoslavians | 75.9 /100 | #158 | Good 15.9% |
Demographics Similar to Immigrants from Uzbekistan by Child Poverty Among Boys Under 16
In terms of child poverty among boys under 16, the demographic groups most similar to Immigrants from Uzbekistan are Immigrants from Sierra Leone (17.3%, a difference of 0.020%), Immigrants from Afghanistan (17.3%, a difference of 0.080%), Ugandan (17.3%, a difference of 0.20%), Immigrants from Portugal (17.4%, a difference of 0.53%), and German Russian (17.4%, a difference of 0.59%).
| Demographics | Rating | Rank | Child Poverty Among Boys Under 16 |
| Spaniards | 20.5 /100 | #196 | Fair 17.1% |
| Immigrants | Kenya | 20.1 /100 | #197 | Fair 17.1% |
| Immigrants | Cameroon | 19.0 /100 | #198 | Poor 17.1% |
| Delaware | 18.8 /100 | #199 | Poor 17.1% |
| Immigrants | Uruguay | 16.9 /100 | #200 | Poor 17.2% |
| Immigrants | Afghanistan | 13.7 /100 | #201 | Poor 17.3% |
| Immigrants | Sierra Leone | 13.4 /100 | #202 | Poor 17.3% |
| Immigrants | Uzbekistan | 13.3 /100 | #203 | Poor 17.3% |
| Ugandans | 12.5 /100 | #204 | Poor 17.3% |
| Immigrants | Portugal | 11.2 /100 | #205 | Poor 17.4% |
| German Russians | 10.9 /100 | #206 | Poor 17.4% |
| Immigrants | Thailand | 8.2 /100 | #207 | Tragic 17.5% |
| Malaysians | 7.6 /100 | #208 | Tragic 17.6% |
| Alaskan Athabascans | 7.3 /100 | #209 | Tragic 17.6% |
| Immigrants | Armenia | 6.8 /100 | #210 | Tragic 17.6% |