Celtic vs Immigrants from Uzbekistan Child Poverty Among Boys Under 16
COMPARE
Celtic
Immigrants from Uzbekistan
Child Poverty Among Boys Under 16
Child Poverty Among Boys Under 16 Comparison
Celtics
Immigrants from Uzbekistan
16.6%
CHILD POVERTY AMONG BOYS UNDER 16
40.6/ 100
METRIC RATING
184th/ 347
METRIC RANK
17.3%
CHILD POVERTY AMONG BOYS UNDER 16
13.3/ 100
METRIC RATING
203rd/ 347
METRIC RANK
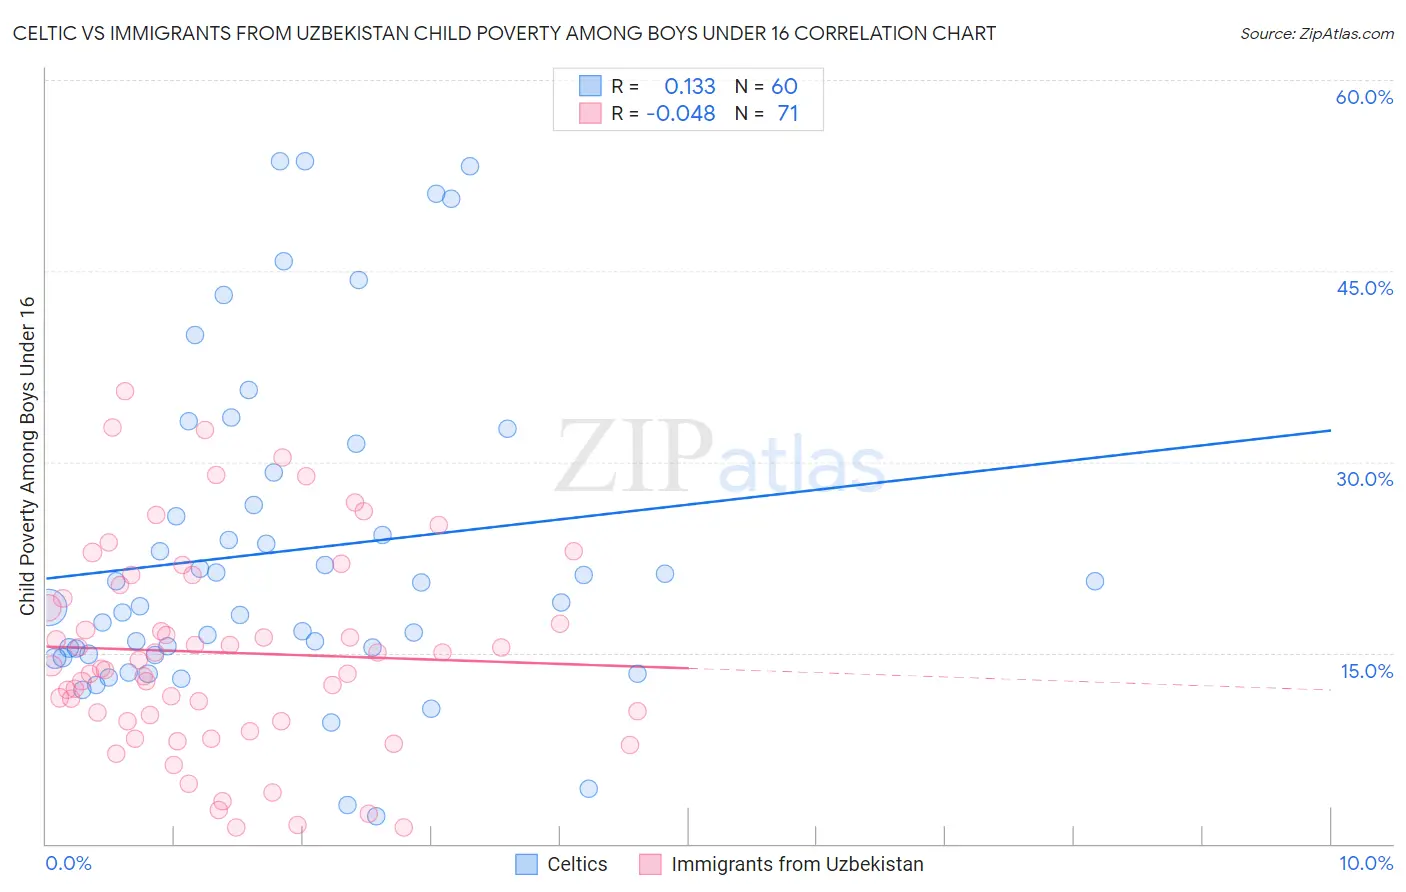
Celtic vs Immigrants from Uzbekistan Child Poverty Among Boys Under 16 Correlation Chart
The statistical analysis conducted on geographies consisting of 167,451,982 people shows a poor positive correlation between the proportion of Celtics and poverty level among boys under the age of 16 in the United States with a correlation coefficient (R) of 0.133 and weighted average of 16.6%. Similarly, the statistical analysis conducted on geographies consisting of 117,928,505 people shows no correlation between the proportion of Immigrants from Uzbekistan and poverty level among boys under the age of 16 in the United States with a correlation coefficient (R) of -0.048 and weighted average of 17.3%, a difference of 4.1%.
Child Poverty Among Boys Under 16 Correlation Summary
| Measurement | Celtic | Immigrants from Uzbekistan |
| Minimum | 2.2% | 1.3% |
| Maximum | 53.6% | 35.6% |
| Range | 51.4% | 34.3% |
| Mean | 23.0% | 15.0% |
| Median | 18.8% | 14.0% |
| Interquartile 25% (IQ1) | 14.8% | 9.7% |
| Interquartile 75% (IQ3) | 27.9% | 20.3% |
| Interquartile Range (IQR) | 13.0% | 10.7% |
| Standard Deviation (Sample) | 12.8% | 8.0% |
| Standard Deviation (Population) | 12.7% | 7.9% |
Demographics Similar to Celtics and Immigrants from Uzbekistan by Child Poverty Among Boys Under 16
In terms of child poverty among boys under 16, the demographic groups most similar to Celtics are Immigrants from Western Asia (16.6%, a difference of 0.030%), Kenyan (16.6%, a difference of 0.040%), Hmong (16.6%, a difference of 0.25%), Immigrants from Costa Rica (16.7%, a difference of 0.33%), and Immigrants from South America (16.7%, a difference of 0.34%). Similarly, the demographic groups most similar to Immigrants from Uzbekistan are Immigrants from Sierra Leone (17.3%, a difference of 0.020%), Immigrants from Afghanistan (17.3%, a difference of 0.080%), Immigrants from Uruguay (17.2%, a difference of 0.76%), Delaware (17.1%, a difference of 1.1%), and Immigrants from Cameroon (17.1%, a difference of 1.1%).
| Demographics | Rating | Rank | Child Poverty Among Boys Under 16 |
| Kenyans | 41.0 /100 | #183 | Average 16.6% |
| Celtics | 40.6 /100 | #184 | Average 16.6% |
| Immigrants | Western Asia | 40.4 /100 | #185 | Average 16.6% |
| Hmong | 38.4 /100 | #186 | Fair 16.6% |
| Immigrants | Costa Rica | 37.8 /100 | #187 | Fair 16.7% |
| Immigrants | South America | 37.7 /100 | #188 | Fair 16.7% |
| Immigrants | Morocco | 34.5 /100 | #189 | Fair 16.7% |
| Arabs | 31.1 /100 | #190 | Fair 16.8% |
| Alaska Natives | 29.8 /100 | #191 | Fair 16.8% |
| Immigrants | Uganda | 21.6 /100 | #192 | Fair 17.0% |
| Immigrants | Iraq | 21.6 /100 | #193 | Fair 17.0% |
| Immigrants | Lebanon | 21.2 /100 | #194 | Fair 17.0% |
| Spanish | 20.8 /100 | #195 | Fair 17.0% |
| Spaniards | 20.5 /100 | #196 | Fair 17.1% |
| Immigrants | Kenya | 20.1 /100 | #197 | Fair 17.1% |
| Immigrants | Cameroon | 19.0 /100 | #198 | Poor 17.1% |
| Delaware | 18.8 /100 | #199 | Poor 17.1% |
| Immigrants | Uruguay | 16.9 /100 | #200 | Poor 17.2% |
| Immigrants | Afghanistan | 13.7 /100 | #201 | Poor 17.3% |
| Immigrants | Sierra Leone | 13.4 /100 | #202 | Poor 17.3% |
| Immigrants | Uzbekistan | 13.3 /100 | #203 | Poor 17.3% |