Yup'ik vs Immigrants from South Central Asia Single Male Poverty
COMPARE
Yup'ik
Immigrants from South Central Asia
Single Male Poverty
Single Male Poverty Comparison
Yup'ik
Immigrants from South Central Asia
31.6%
SINGLE MALE POVERTY
0.0/ 100
METRIC RATING
347th/ 347
METRIC RANK
10.9%
SINGLE MALE POVERTY
100.0/ 100
METRIC RATING
13th/ 347
METRIC RANK
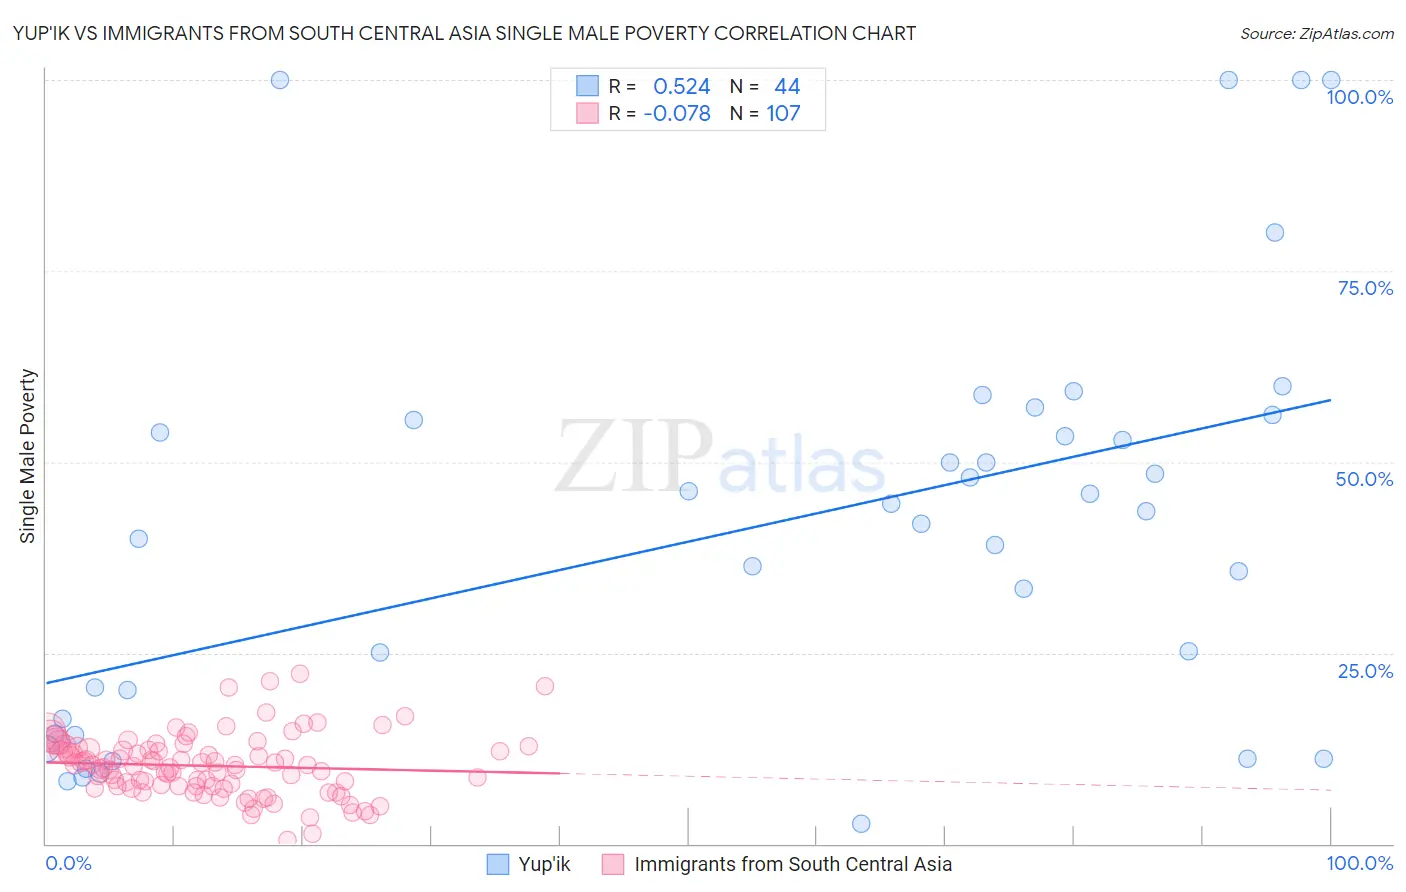
Yup'ik vs Immigrants from South Central Asia Single Male Poverty Correlation Chart
The statistical analysis conducted on geographies consisting of 38,853,365 people shows a substantial positive correlation between the proportion of Yup'ik and poverty level among single males in the United States with a correlation coefficient (R) of 0.524 and weighted average of 31.6%. Similarly, the statistical analysis conducted on geographies consisting of 409,069,639 people shows a slight negative correlation between the proportion of Immigrants from South Central Asia and poverty level among single males in the United States with a correlation coefficient (R) of -0.078 and weighted average of 10.9%, a difference of 189.6%.
Single Male Poverty Correlation Summary
| Measurement | Yup'ik | Immigrants from South Central Asia |
| Minimum | 2.6% | 0.44% |
| Maximum | 100.0% | 22.2% |
| Range | 97.4% | 21.8% |
| Mean | 41.1% | 10.2% |
| Median | 42.7% | 10.3% |
| Interquartile 25% (IQ1) | 15.4% | 7.5% |
| Interquartile 75% (IQ3) | 54.7% | 12.4% |
| Interquartile Range (IQR) | 39.3% | 4.9% |
| Standard Deviation (Sample) | 26.6% | 4.0% |
| Standard Deviation (Population) | 26.3% | 4.0% |
Similar Demographics by Single Male Poverty
Demographics Similar to Yup'ik by Single Male Poverty
In terms of single male poverty, the demographic groups most similar to Yup'ik are Hopi (27.5%, a difference of 15.0%), Navajo (25.3%, a difference of 24.8%), Lumbee (25.2%, a difference of 25.7%), Puerto Rican (25.1%, a difference of 26.1%), and Houma (23.5%, a difference of 34.9%).
| Demographics | Rating | Rank | Single Male Poverty |
| Inupiat | 0.0 /100 | #333 | Tragic 20.0% |
| Pima | 0.0 /100 | #334 | Tragic 20.2% |
| Yuman | 0.0 /100 | #335 | Tragic 21.3% |
| Tohono O'odham | 0.0 /100 | #336 | Tragic 21.6% |
| Apache | 0.0 /100 | #337 | Tragic 21.6% |
| Pueblo | 0.0 /100 | #338 | Tragic 21.6% |
| Arapaho | 0.0 /100 | #339 | Tragic 21.9% |
| Sioux | 0.0 /100 | #340 | Tragic 22.2% |
| Crow | 0.0 /100 | #341 | Tragic 23.3% |
| Houma | 0.0 /100 | #342 | Tragic 23.5% |
| Puerto Ricans | 0.0 /100 | #343 | Tragic 25.1% |
| Lumbee | 0.0 /100 | #344 | Tragic 25.2% |
| Navajo | 0.0 /100 | #345 | Tragic 25.3% |
| Hopi | 0.0 /100 | #346 | Tragic 27.5% |
| Yup'ik | 0.0 /100 | #347 | Tragic 31.6% |
Demographics Similar to Immigrants from South Central Asia by Single Male Poverty
In terms of single male poverty, the demographic groups most similar to Immigrants from South Central Asia are Immigrants from Afghanistan (10.9%, a difference of 0.12%), Immigrants from Philippines (10.9%, a difference of 0.20%), Immigrants from Fiji (10.9%, a difference of 0.22%), Taiwanese (10.9%, a difference of 0.27%), and Chinese (11.0%, a difference of 0.57%).
| Demographics | Rating | Rank | Single Male Poverty |
| Filipinos | 100.0 /100 | #6 | Exceptional 10.6% |
| Afghans | 100.0 /100 | #7 | Exceptional 10.7% |
| Thais | 100.0 /100 | #8 | Exceptional 10.8% |
| Taiwanese | 100.0 /100 | #9 | Exceptional 10.9% |
| Immigrants | Fiji | 100.0 /100 | #10 | Exceptional 10.9% |
| Immigrants | Philippines | 100.0 /100 | #11 | Exceptional 10.9% |
| Immigrants | Afghanistan | 100.0 /100 | #12 | Exceptional 10.9% |
| Immigrants | South Central Asia | 100.0 /100 | #13 | Exceptional 10.9% |
| Chinese | 100.0 /100 | #14 | Exceptional 11.0% |
| Koreans | 100.0 /100 | #15 | Exceptional 11.0% |
| Bhutanese | 100.0 /100 | #16 | Exceptional 11.1% |
| Tsimshian | 100.0 /100 | #17 | Exceptional 11.1% |
| Immigrants | Bolivia | 100.0 /100 | #18 | Exceptional 11.1% |
| Immigrants | Moldova | 100.0 /100 | #19 | Exceptional 11.2% |
| Ethiopians | 100.0 /100 | #20 | Exceptional 11.2% |