Yup'ik vs Immigrants from South Central Asia Currently Married
COMPARE
Yup'ik
Immigrants from South Central Asia
Currently Married
Currently Married Comparison
Yup'ik
Immigrants from South Central Asia
39.9%
CURRENTLY MARRIED
0.0/ 100
METRIC RATING
333rd/ 347
METRIC RANK
50.0%
CURRENTLY MARRIED
100.0/ 100
METRIC RATING
7th/ 347
METRIC RANK
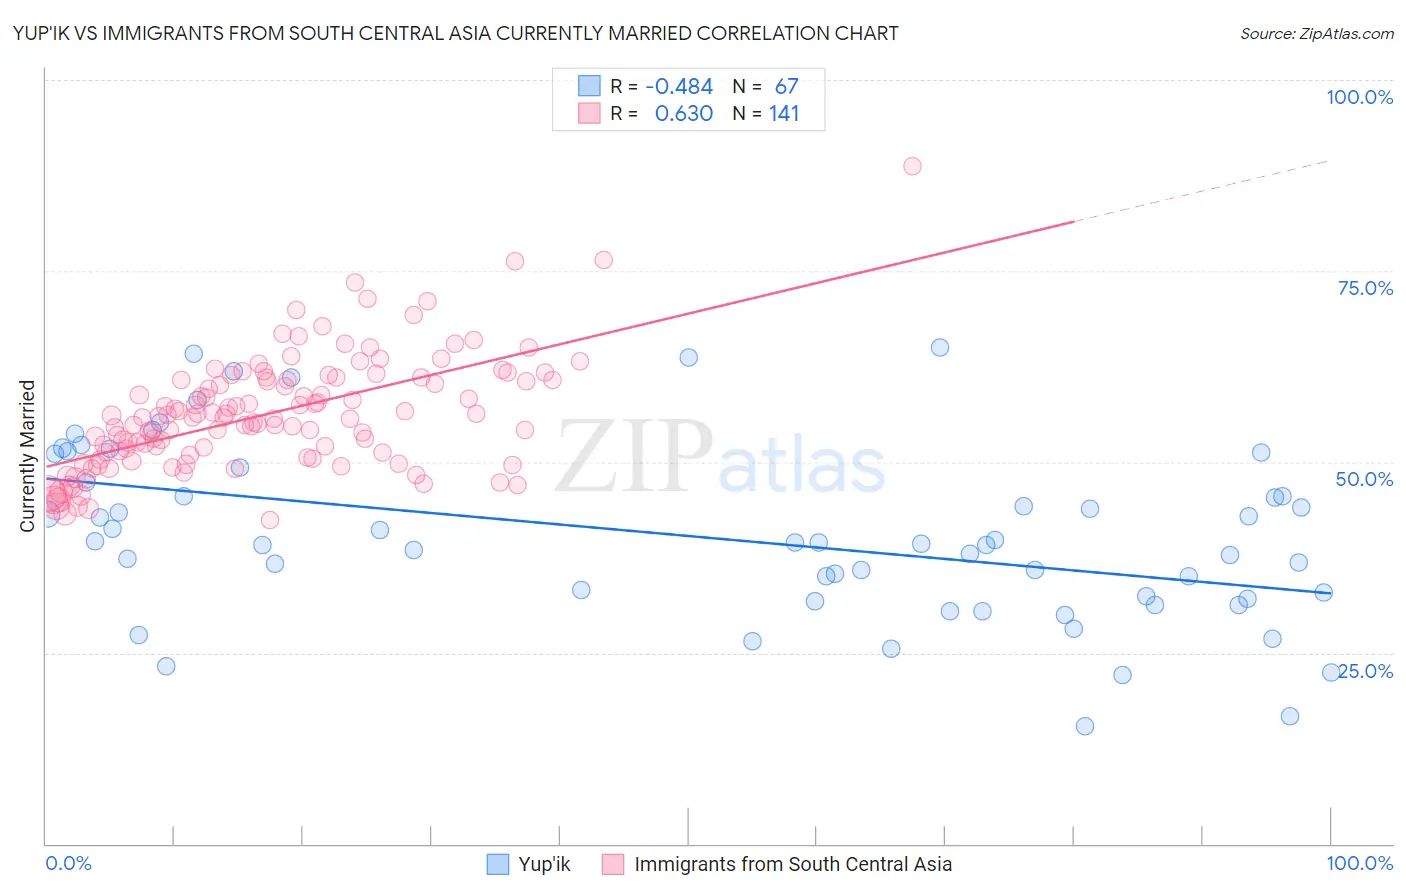
Yup'ik vs Immigrants from South Central Asia Currently Married Correlation Chart
The statistical analysis conducted on geographies consisting of 39,963,234 people shows a moderate negative correlation between the proportion of Yup'ik and percentage of population currently married in the United States with a correlation coefficient (R) of -0.484 and weighted average of 39.9%. Similarly, the statistical analysis conducted on geographies consisting of 473,021,987 people shows a significant positive correlation between the proportion of Immigrants from South Central Asia and percentage of population currently married in the United States with a correlation coefficient (R) of 0.630 and weighted average of 50.0%, a difference of 25.3%.
Currently Married Correlation Summary
| Measurement | Yup'ik | Immigrants from South Central Asia |
| Minimum | 15.4% | 42.4% |
| Maximum | 65.0% | 88.7% |
| Range | 49.6% | 46.3% |
| Mean | 40.2% | 56.2% |
| Median | 39.2% | 55.8% |
| Interquartile 25% (IQ1) | 32.1% | 50.7% |
| Interquartile 75% (IQ3) | 47.3% | 60.7% |
| Interquartile Range (IQR) | 15.2% | 10.0% |
| Standard Deviation (Sample) | 11.4% | 7.4% |
| Standard Deviation (Population) | 11.3% | 7.4% |
Similar Demographics by Currently Married
Demographics Similar to Yup'ik by Currently Married
In terms of currently married, the demographic groups most similar to Yup'ik are Puerto Rican (39.9%, a difference of 0.010%), Lumbee (39.8%, a difference of 0.18%), British West Indian (39.8%, a difference of 0.35%), Immigrants from St. Vincent and the Grenadines (40.1%, a difference of 0.39%), and Black/African American (39.6%, a difference of 0.73%).
| Demographics | Rating | Rank | Currently Married |
| Barbadians | 0.0 /100 | #326 | Tragic 40.6% |
| Senegalese | 0.0 /100 | #327 | Tragic 40.6% |
| Arapaho | 0.0 /100 | #328 | Tragic 40.5% |
| Crow | 0.0 /100 | #329 | Tragic 40.4% |
| Immigrants | Dominica | 0.0 /100 | #330 | Tragic 40.3% |
| Immigrants | Barbados | 0.0 /100 | #331 | Tragic 40.3% |
| Immigrants | St. Vincent and the Grenadines | 0.0 /100 | #332 | Tragic 40.1% |
| Yup'ik | 0.0 /100 | #333 | Tragic 39.9% |
| Puerto Ricans | 0.0 /100 | #334 | Tragic 39.9% |
| Lumbee | 0.0 /100 | #335 | Tragic 39.8% |
| British West Indians | 0.0 /100 | #336 | Tragic 39.8% |
| Blacks/African Americans | 0.0 /100 | #337 | Tragic 39.6% |
| Cape Verdeans | 0.0 /100 | #338 | Tragic 39.6% |
| Dominicans | 0.0 /100 | #339 | Tragic 39.5% |
| Immigrants | Grenada | 0.0 /100 | #340 | Tragic 39.1% |
Demographics Similar to Immigrants from South Central Asia by Currently Married
In terms of currently married, the demographic groups most similar to Immigrants from South Central Asia are Swedish (50.0%, a difference of 0.13%), Czech (49.9%, a difference of 0.32%), Norwegian (50.2%, a difference of 0.34%), Filipino (49.7%, a difference of 0.58%), and English (49.7%, a difference of 0.59%).
| Demographics | Rating | Rank | Currently Married |
| Immigrants | India | 100.0 /100 | #1 | Exceptional 51.8% |
| Thais | 100.0 /100 | #2 | Exceptional 50.9% |
| Assyrians/Chaldeans/Syriacs | 100.0 /100 | #3 | Exceptional 50.8% |
| Immigrants | Taiwan | 100.0 /100 | #4 | Exceptional 50.7% |
| Danes | 100.0 /100 | #5 | Exceptional 50.5% |
| Norwegians | 100.0 /100 | #6 | Exceptional 50.2% |
| Immigrants | South Central Asia | 100.0 /100 | #7 | Exceptional 50.0% |
| Swedes | 100.0 /100 | #8 | Exceptional 50.0% |
| Czechs | 99.9 /100 | #9 | Exceptional 49.9% |
| Filipinos | 99.9 /100 | #10 | Exceptional 49.7% |
| English | 99.9 /100 | #11 | Exceptional 49.7% |
| Swiss | 99.9 /100 | #12 | Exceptional 49.7% |
| Dutch | 99.9 /100 | #13 | Exceptional 49.6% |
| Germans | 99.9 /100 | #14 | Exceptional 49.6% |
| Pennsylvania Germans | 99.9 /100 | #15 | Exceptional 49.6% |