Immigrants from St. Vincent and the Grenadines vs Immigrants from Eritrea Child Poverty Among Boys Under 16
COMPARE
Immigrants from St. Vincent and the Grenadines
Immigrants from Eritrea
Child Poverty Among Boys Under 16
Child Poverty Among Boys Under 16 Comparison
Immigrants from St. Vincent and the Grenadines
Immigrants from Eritrea
20.3%
CHILD POVERTY AMONG BOYS UNDER 16
0.0/ 100
METRIC RATING
288th/ 347
METRIC RANK
18.6%
CHILD POVERTY AMONG BOYS UNDER 16
0.8/ 100
METRIC RATING
237th/ 347
METRIC RANK
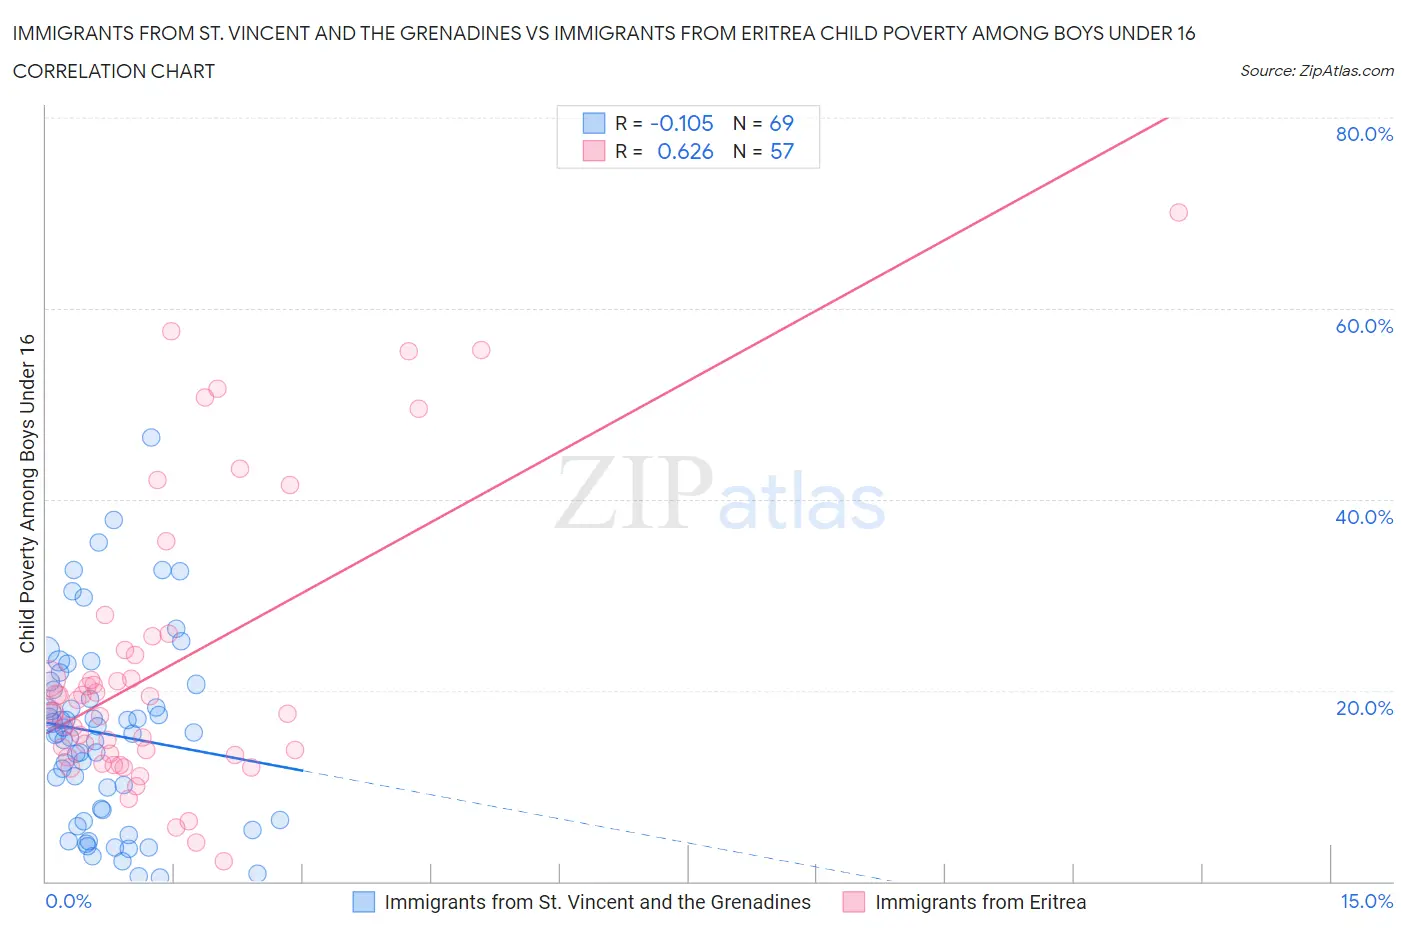
Immigrants from St. Vincent and the Grenadines vs Immigrants from Eritrea Child Poverty Among Boys Under 16 Correlation Chart
The statistical analysis conducted on geographies consisting of 56,103,487 people shows a poor negative correlation between the proportion of Immigrants from St. Vincent and the Grenadines and poverty level among boys under the age of 16 in the United States with a correlation coefficient (R) of -0.105 and weighted average of 20.3%. Similarly, the statistical analysis conducted on geographies consisting of 104,677,274 people shows a significant positive correlation between the proportion of Immigrants from Eritrea and poverty level among boys under the age of 16 in the United States with a correlation coefficient (R) of 0.626 and weighted average of 18.6%, a difference of 9.1%.
Child Poverty Among Boys Under 16 Correlation Summary
| Measurement | Immigrants from St. Vincent and the Grenadines | Immigrants from Eritrea |
| Minimum | 0.43% | 2.0% |
| Maximum | 46.4% | 70.0% |
| Range | 46.0% | 68.0% |
| Mean | 15.5% | 22.5% |
| Median | 15.5% | 17.7% |
| Interquartile 25% (IQ1) | 6.9% | 13.1% |
| Interquartile 75% (IQ3) | 20.3% | 24.9% |
| Interquartile Range (IQR) | 13.4% | 11.8% |
| Standard Deviation (Sample) | 9.8% | 15.2% |
| Standard Deviation (Population) | 9.7% | 15.0% |
Similar Demographics by Child Poverty Among Boys Under 16
Demographics Similar to Immigrants from St. Vincent and the Grenadines by Child Poverty Among Boys Under 16
In terms of child poverty among boys under 16, the demographic groups most similar to Immigrants from St. Vincent and the Grenadines are Blackfeet (20.4%, a difference of 0.24%), Immigrants from Belize (20.3%, a difference of 0.27%), West Indian (20.3%, a difference of 0.33%), Arapaho (20.2%, a difference of 0.68%), and Barbadian (20.2%, a difference of 0.82%).
| Demographics | Rating | Rank | Child Poverty Among Boys Under 16 |
| Immigrants | Zaire | 0.0 /100 | #281 | Tragic 20.1% |
| Comanche | 0.0 /100 | #282 | Tragic 20.1% |
| Immigrants | Jamaica | 0.0 /100 | #283 | Tragic 20.1% |
| Barbadians | 0.0 /100 | #284 | Tragic 20.2% |
| Arapaho | 0.0 /100 | #285 | Tragic 20.2% |
| West Indians | 0.0 /100 | #286 | Tragic 20.3% |
| Immigrants | Belize | 0.0 /100 | #287 | Tragic 20.3% |
| Immigrants | St. Vincent and the Grenadines | 0.0 /100 | #288 | Tragic 20.3% |
| Blackfeet | 0.0 /100 | #289 | Tragic 20.4% |
| Senegalese | 0.0 /100 | #290 | Tragic 20.6% |
| Immigrants | Latin America | 0.0 /100 | #291 | Tragic 20.6% |
| Yaqui | 0.0 /100 | #292 | Tragic 20.7% |
| Immigrants | Senegal | 0.0 /100 | #293 | Tragic 20.7% |
| Immigrants | Bahamas | 0.0 /100 | #294 | Tragic 20.7% |
| Mexicans | 0.0 /100 | #295 | Tragic 20.7% |
Demographics Similar to Immigrants from Eritrea by Child Poverty Among Boys Under 16
In terms of child poverty among boys under 16, the demographic groups most similar to Immigrants from Eritrea are Sudanese (18.6%, a difference of 0.15%), Immigrants from Laos (18.7%, a difference of 0.22%), American (18.6%, a difference of 0.24%), Cape Verdean (18.7%, a difference of 0.45%), and Nigerian (18.5%, a difference of 0.74%).
| Demographics | Rating | Rank | Child Poverty Among Boys Under 16 |
| Fijians | 1.8 /100 | #230 | Tragic 18.3% |
| Nicaraguans | 1.4 /100 | #231 | Tragic 18.4% |
| Marshallese | 1.3 /100 | #232 | Tragic 18.4% |
| Immigrants | Nigeria | 1.2 /100 | #233 | Tragic 18.4% |
| Nigerians | 1.1 /100 | #234 | Tragic 18.5% |
| Americans | 0.9 /100 | #235 | Tragic 18.6% |
| Sudanese | 0.9 /100 | #236 | Tragic 18.6% |
| Immigrants | Eritrea | 0.8 /100 | #237 | Tragic 18.6% |
| Immigrants | Laos | 0.8 /100 | #238 | Tragic 18.7% |
| Cape Verdeans | 0.7 /100 | #239 | Tragic 18.7% |
| Immigrants | Cuba | 0.6 /100 | #240 | Tragic 18.8% |
| Immigrants | Sudan | 0.6 /100 | #241 | Tragic 18.8% |
| Ghanaians | 0.5 /100 | #242 | Tragic 18.9% |
| Immigrants | Azores | 0.4 /100 | #243 | Tragic 18.9% |
| Immigrants | Middle Africa | 0.4 /100 | #244 | Tragic 18.9% |