Immigrants from Colombia vs Immigrants from Ecuador Female Poverty Among 25-34 Year Olds
COMPARE
Immigrants from Colombia
Immigrants from Ecuador
Female Poverty Among 25-34 Year Olds
Female Poverty Among 25-34 Year Olds Comparison
Immigrants from Colombia
Immigrants from Ecuador
13.3%
FEMALE POVERTY AMONG 25-34 YEAR OLDS
69.2/ 100
METRIC RATING
158th/ 347
METRIC RANK
14.6%
FEMALE POVERTY AMONG 25-34 YEAR OLDS
1.9/ 100
METRIC RATING
232nd/ 347
METRIC RANK
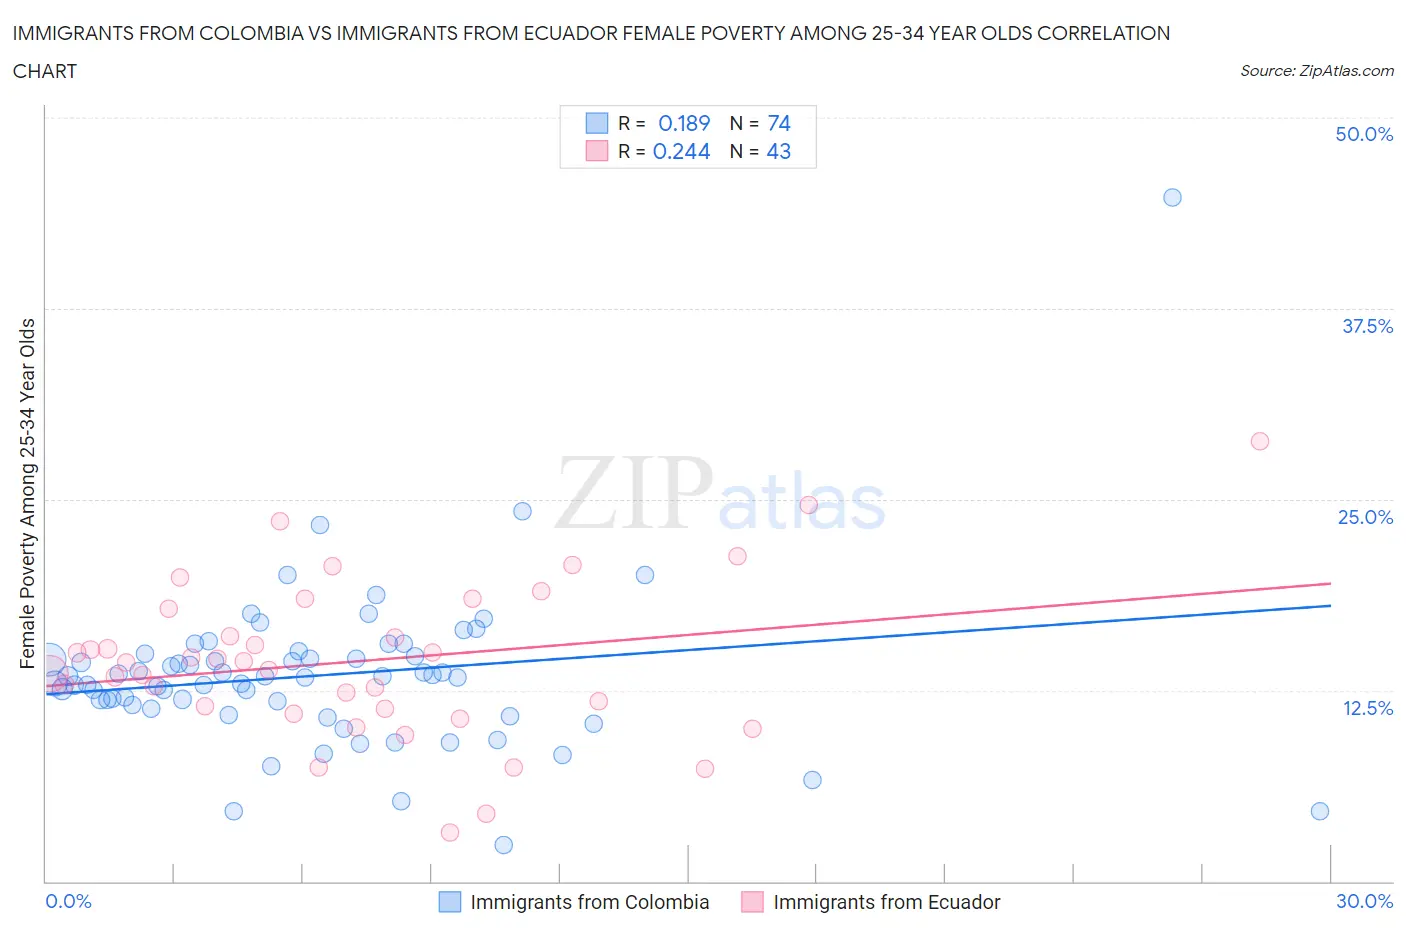
Immigrants from Colombia vs Immigrants from Ecuador Female Poverty Among 25-34 Year Olds Correlation Chart
The statistical analysis conducted on geographies consisting of 373,334,507 people shows a poor positive correlation between the proportion of Immigrants from Colombia and poverty level among females between the ages 25 and 34 in the United States with a correlation coefficient (R) of 0.189 and weighted average of 13.3%. Similarly, the statistical analysis conducted on geographies consisting of 268,011,049 people shows a weak positive correlation between the proportion of Immigrants from Ecuador and poverty level among females between the ages 25 and 34 in the United States with a correlation coefficient (R) of 0.244 and weighted average of 14.6%, a difference of 10.0%.
Female Poverty Among 25-34 Year Olds Correlation Summary
| Measurement | Immigrants from Colombia | Immigrants from Ecuador |
| Minimum | 2.4% | 3.2% |
| Maximum | 44.7% | 28.8% |
| Range | 42.4% | 25.6% |
| Mean | 13.5% | 14.4% |
| Median | 13.4% | 14.3% |
| Interquartile 25% (IQ1) | 11.5% | 11.3% |
| Interquartile 75% (IQ3) | 14.8% | 17.9% |
| Interquartile Range (IQR) | 3.2% | 6.5% |
| Standard Deviation (Sample) | 5.3% | 5.2% |
| Standard Deviation (Population) | 5.3% | 5.1% |
Similar Demographics by Female Poverty Among 25-34 Year Olds
Demographics Similar to Immigrants from Colombia by Female Poverty Among 25-34 Year Olds
In terms of female poverty among 25-34 year olds, the demographic groups most similar to Immigrants from Colombia are Immigrants from Western Europe (13.3%, a difference of 0.11%), Uruguayan (13.3%, a difference of 0.22%), Immigrants from Cameroon (13.3%, a difference of 0.28%), Immigrants from South America (13.3%, a difference of 0.28%), and Icelander (13.3%, a difference of 0.34%).
| Demographics | Rating | Rank | Female Poverty Among 25-34 Year Olds |
| Costa Ricans | 75.8 /100 | #151 | Good 13.2% |
| Slavs | 75.7 /100 | #152 | Good 13.2% |
| Northern Europeans | 73.7 /100 | #153 | Good 13.2% |
| Arabs | 73.5 /100 | #154 | Good 13.2% |
| Immigrants | Sierra Leone | 72.9 /100 | #155 | Good 13.3% |
| Immigrants | Cameroon | 72.0 /100 | #156 | Good 13.3% |
| Immigrants | Western Europe | 70.3 /100 | #157 | Good 13.3% |
| Immigrants | Colombia | 69.2 /100 | #158 | Good 13.3% |
| Uruguayans | 66.9 /100 | #159 | Good 13.3% |
| Immigrants | South America | 66.3 /100 | #160 | Good 13.3% |
| Icelanders | 65.7 /100 | #161 | Good 13.3% |
| Ugandans | 64.1 /100 | #162 | Good 13.4% |
| British | 63.5 /100 | #163 | Good 13.4% |
| Swiss | 61.7 /100 | #164 | Good 13.4% |
| Basques | 59.3 /100 | #165 | Average 13.4% |
Demographics Similar to Immigrants from Ecuador by Female Poverty Among 25-34 Year Olds
In terms of female poverty among 25-34 year olds, the demographic groups most similar to Immigrants from Ecuador are White/Caucasian (14.7%, a difference of 0.18%), Delaware (14.6%, a difference of 0.31%), Spaniard (14.6%, a difference of 0.36%), Cuban (14.7%, a difference of 0.41%), and Spanish (14.6%, a difference of 0.49%).
| Demographics | Rating | Rank | Female Poverty Among 25-34 Year Olds |
| Immigrants | Barbados | 3.4 /100 | #225 | Tragic 14.5% |
| Nicaraguans | 3.3 /100 | #226 | Tragic 14.5% |
| Celtics | 2.8 /100 | #227 | Tragic 14.5% |
| Vietnamese | 2.6 /100 | #228 | Tragic 14.6% |
| Spanish | 2.5 /100 | #229 | Tragic 14.6% |
| Spaniards | 2.3 /100 | #230 | Tragic 14.6% |
| Delaware | 2.3 /100 | #231 | Tragic 14.6% |
| Immigrants | Ecuador | 1.9 /100 | #232 | Tragic 14.6% |
| Whites/Caucasians | 1.8 /100 | #233 | Tragic 14.7% |
| Cubans | 1.6 /100 | #234 | Tragic 14.7% |
| Immigrants | Jamaica | 1.4 /100 | #235 | Tragic 14.7% |
| Salvadorans | 1.4 /100 | #236 | Tragic 14.7% |
| Immigrants | Ghana | 1.4 /100 | #237 | Tragic 14.7% |
| Alsatians | 1.4 /100 | #238 | Tragic 14.7% |
| Malaysians | 1.4 /100 | #239 | Tragic 14.7% |