Yup'ik vs Estonian Male Poverty
COMPARE
Yup'ik
Estonian
Male Poverty
Male Poverty Comparison
Yup'ik
Estonians
20.4%
MALE POVERTY
0.0/ 100
METRIC RATING
343rd/ 347
METRIC RANK
10.1%
MALE POVERTY
98.1/ 100
METRIC RATING
57th/ 347
METRIC RANK
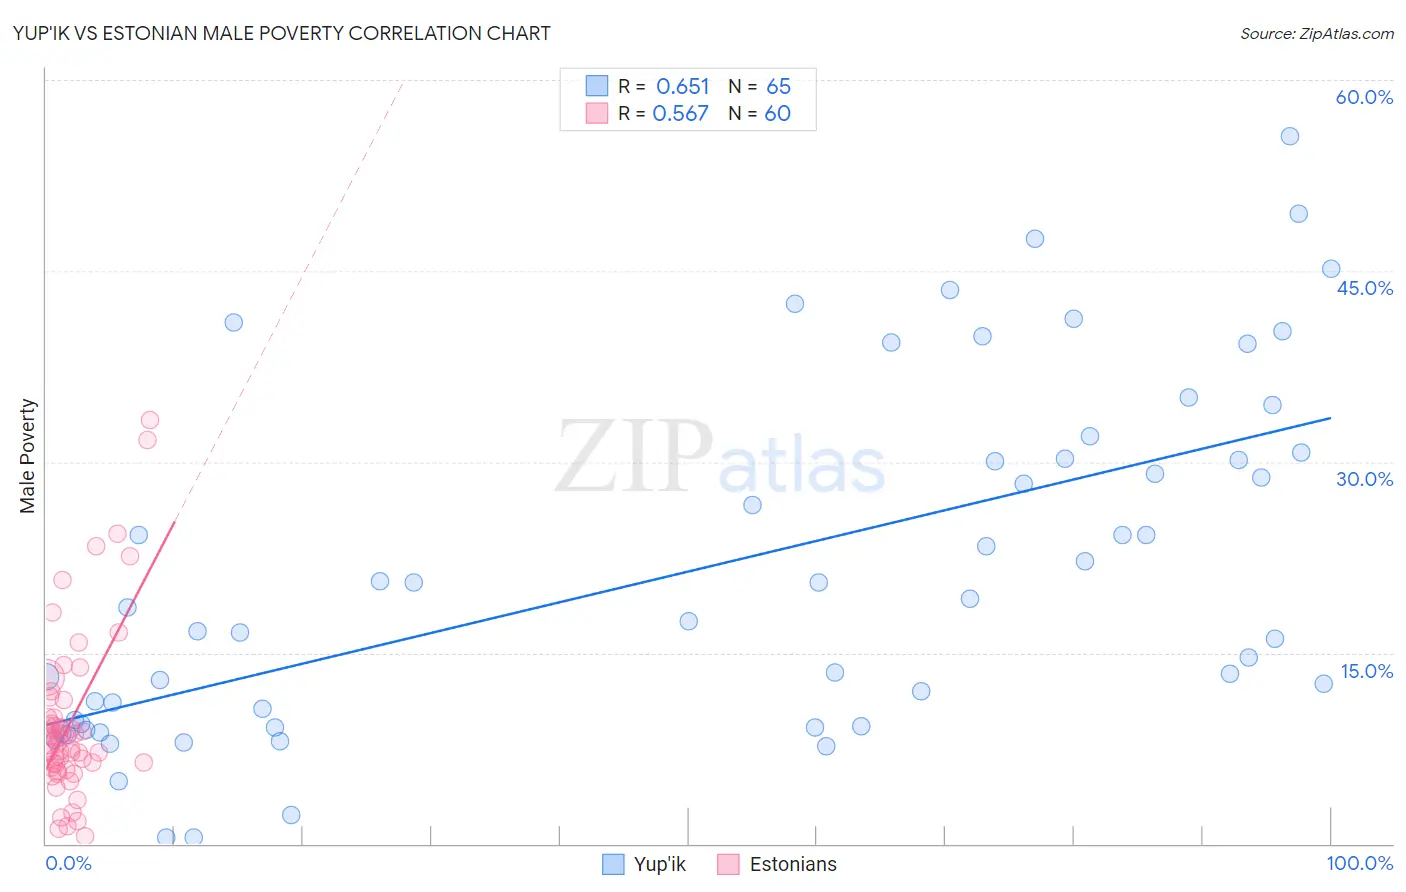
Yup'ik vs Estonian Male Poverty Correlation Chart
The statistical analysis conducted on geographies consisting of 39,962,746 people shows a significant positive correlation between the proportion of Yup'ik and poverty level among males in the United States with a correlation coefficient (R) of 0.651 and weighted average of 20.4%. Similarly, the statistical analysis conducted on geographies consisting of 123,489,486 people shows a substantial positive correlation between the proportion of Estonians and poverty level among males in the United States with a correlation coefficient (R) of 0.567 and weighted average of 10.1%, a difference of 101.6%.
Male Poverty Correlation Summary
| Measurement | Yup'ik | Estonian |
| Minimum | 0.50% | 0.61% |
| Maximum | 55.6% | 33.3% |
| Range | 55.1% | 32.7% |
| Mean | 21.5% | 9.6% |
| Median | 18.6% | 8.0% |
| Interquartile 25% (IQ1) | 9.4% | 6.1% |
| Interquartile 75% (IQ3) | 30.5% | 10.6% |
| Interquartile Range (IQR) | 21.1% | 4.5% |
| Standard Deviation (Sample) | 13.7% | 6.7% |
| Standard Deviation (Population) | 13.6% | 6.7% |
Similar Demographics by Male Poverty
Demographics Similar to Yup'ik by Male Poverty
In terms of male poverty, the demographic groups most similar to Yup'ik are Pima (20.4%, a difference of 0.10%), Lumbee (20.2%, a difference of 0.88%), Immigrants from Yemen (20.1%, a difference of 1.2%), Hopi (20.8%, a difference of 2.1%), and Yuman (19.5%, a difference of 4.3%).
| Demographics | Rating | Rank | Male Poverty |
| Natives/Alaskans | 0.0 /100 | #333 | Tragic 16.9% |
| Cheyenne | 0.0 /100 | #334 | Tragic 17.6% |
| Apache | 0.0 /100 | #335 | Tragic 17.7% |
| Pueblo | 0.0 /100 | #336 | Tragic 18.5% |
| Sioux | 0.0 /100 | #337 | Tragic 18.7% |
| Crow | 0.0 /100 | #338 | Tragic 19.1% |
| Yuman | 0.0 /100 | #339 | Tragic 19.5% |
| Immigrants | Yemen | 0.0 /100 | #340 | Tragic 20.1% |
| Lumbee | 0.0 /100 | #341 | Tragic 20.2% |
| Pima | 0.0 /100 | #342 | Tragic 20.4% |
| Yup'ik | 0.0 /100 | #343 | Tragic 20.4% |
| Hopi | 0.0 /100 | #344 | Tragic 20.8% |
| Puerto Ricans | 0.0 /100 | #345 | Tragic 22.0% |
| Navajo | 0.0 /100 | #346 | Tragic 22.3% |
| Tohono O'odham | 0.0 /100 | #347 | Tragic 22.9% |
Demographics Similar to Estonians by Male Poverty
In terms of male poverty, the demographic groups most similar to Estonians are Scandinavian (10.1%, a difference of 0.070%), Immigrants from Bulgaria (10.1%, a difference of 0.14%), Immigrants from Europe (10.1%, a difference of 0.21%), Ukrainian (10.1%, a difference of 0.30%), and Austrian (10.1%, a difference of 0.31%).
| Demographics | Rating | Rank | Male Poverty |
| Immigrants | Philippines | 98.7 /100 | #50 | Exceptional 10.0% |
| Immigrants | Croatia | 98.7 /100 | #51 | Exceptional 10.0% |
| Asians | 98.7 /100 | #52 | Exceptional 10.0% |
| Immigrants | Czechoslovakia | 98.6 /100 | #53 | Exceptional 10.0% |
| Immigrants | Austria | 98.5 /100 | #54 | Exceptional 10.0% |
| Germans | 98.3 /100 | #55 | Exceptional 10.1% |
| Immigrants | Bulgaria | 98.2 /100 | #56 | Exceptional 10.1% |
| Estonians | 98.1 /100 | #57 | Exceptional 10.1% |
| Scandinavians | 98.0 /100 | #58 | Exceptional 10.1% |
| Immigrants | Europe | 97.9 /100 | #59 | Exceptional 10.1% |
| Ukrainians | 97.9 /100 | #60 | Exceptional 10.1% |
| Austrians | 97.8 /100 | #61 | Exceptional 10.1% |
| Immigrants | Italy | 97.8 /100 | #62 | Exceptional 10.2% |
| Slovaks | 97.7 /100 | #63 | Exceptional 10.2% |
| Swiss | 97.5 /100 | #64 | Exceptional 10.2% |