Yup'ik vs Estonian 8th Grade
COMPARE
Yup'ik
Estonian
8th Grade
8th Grade Comparison
Yup'ik
Estonians
97.0%
8TH GRADE
100.0/ 100
METRIC RATING
32nd/ 347
METRIC RANK
96.8%
8TH GRADE
99.9/ 100
METRIC RATING
49th/ 347
METRIC RANK
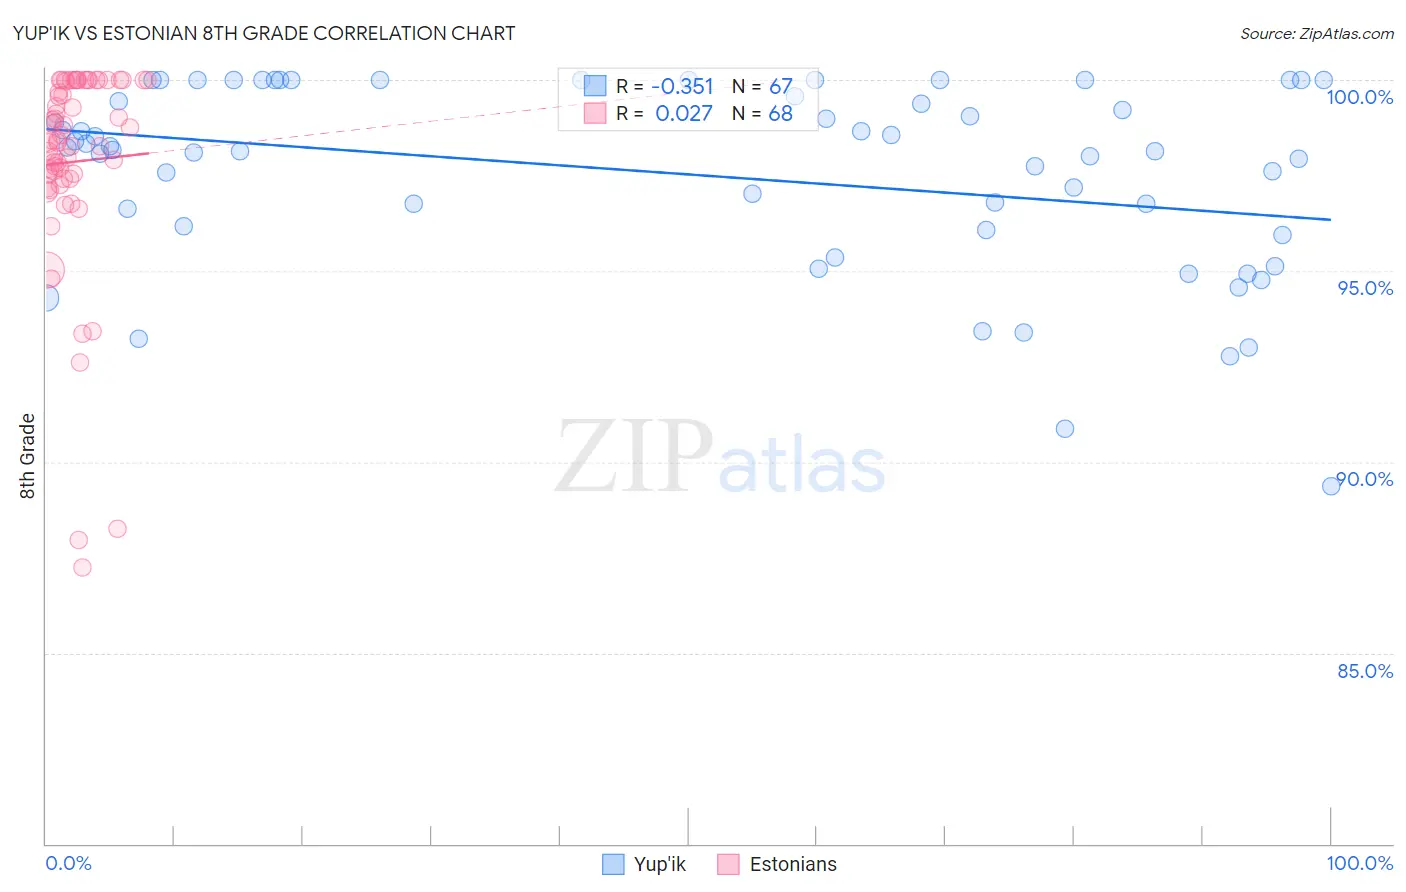
Yup'ik vs Estonian 8th Grade Correlation Chart
The statistical analysis conducted on geographies consisting of 39,963,824 people shows a mild negative correlation between the proportion of Yup'ik and percentage of population with at least 8th grade education in the United States with a correlation coefficient (R) of -0.351 and weighted average of 97.0%. Similarly, the statistical analysis conducted on geographies consisting of 123,528,404 people shows no correlation between the proportion of Estonians and percentage of population with at least 8th grade education in the United States with a correlation coefficient (R) of 0.027 and weighted average of 96.8%, a difference of 0.24%.
8th Grade Correlation Summary
| Measurement | Yup'ik | Estonian |
| Minimum | 89.4% | 87.2% |
| Maximum | 100.0% | 100.0% |
| Range | 10.6% | 12.8% |
| Mean | 97.5% | 97.9% |
| Median | 98.2% | 98.4% |
| Interquartile 25% (IQ1) | 96.1% | 97.4% |
| Interquartile 75% (IQ3) | 100.0% | 100.0% |
| Interquartile Range (IQR) | 3.9% | 2.6% |
| Standard Deviation (Sample) | 2.5% | 2.8% |
| Standard Deviation (Population) | 2.5% | 2.7% |
Demographics Similar to Yup'ik and Estonians by 8th Grade
In terms of 8th grade, the demographic groups most similar to Yup'ik are Swiss (97.0%, a difference of 0.010%), Sioux (97.1%, a difference of 0.030%), Chippewa (97.1%, a difference of 0.030%), Luxembourger (97.0%, a difference of 0.040%), and Alaska Native (97.0%, a difference of 0.050%). Similarly, the demographic groups most similar to Estonians are Slavic (96.8%, a difference of 0.010%), Immigrants from Scotland (96.8%, a difference of 0.010%), Bulgarian (96.9%, a difference of 0.040%), Czechoslovakian (96.9%, a difference of 0.050%), and Maltese (96.9%, a difference of 0.060%).
| Demographics | Rating | Rank | 8th Grade |
| Sioux | 100.0 /100 | #30 | Exceptional 97.1% |
| Chippewa | 100.0 /100 | #31 | Exceptional 97.1% |
| Yup'ik | 100.0 /100 | #32 | Exceptional 97.0% |
| Swiss | 100.0 /100 | #33 | Exceptional 97.0% |
| Luxembourgers | 100.0 /100 | #34 | Exceptional 97.0% |
| Alaska Natives | 100.0 /100 | #35 | Exceptional 97.0% |
| Belgians | 100.0 /100 | #36 | Exceptional 97.0% |
| Latvians | 100.0 /100 | #37 | Exceptional 97.0% |
| British | 100.0 /100 | #38 | Exceptional 97.0% |
| Hungarians | 100.0 /100 | #39 | Exceptional 97.0% |
| Inupiat | 100.0 /100 | #40 | Exceptional 97.0% |
| Eastern Europeans | 100.0 /100 | #41 | Exceptional 97.0% |
| Chinese | 100.0 /100 | #42 | Exceptional 96.9% |
| Aleuts | 99.9 /100 | #43 | Exceptional 96.9% |
| Maltese | 99.9 /100 | #44 | Exceptional 96.9% |
| Northern Europeans | 99.9 /100 | #45 | Exceptional 96.9% |
| Czechoslovakians | 99.9 /100 | #46 | Exceptional 96.9% |
| Bulgarians | 99.9 /100 | #47 | Exceptional 96.9% |
| Slavs | 99.9 /100 | #48 | Exceptional 96.8% |
| Estonians | 99.9 /100 | #49 | Exceptional 96.8% |
| Immigrants | Scotland | 99.9 /100 | #50 | Exceptional 96.8% |