Immigrants from France vs Scottish Female Poverty Among 25-34 Year Olds
COMPARE
Immigrants from France
Scottish
Female Poverty Among 25-34 Year Olds
Female Poverty Among 25-34 Year Olds Comparison
Immigrants from France
Scottish
12.6%
FEMALE POVERTY AMONG 25-34 YEAR OLDS
96.8/ 100
METRIC RATING
94th/ 347
METRIC RANK
13.9%
FEMALE POVERTY AMONG 25-34 YEAR OLDS
23.6/ 100
METRIC RATING
196th/ 347
METRIC RANK
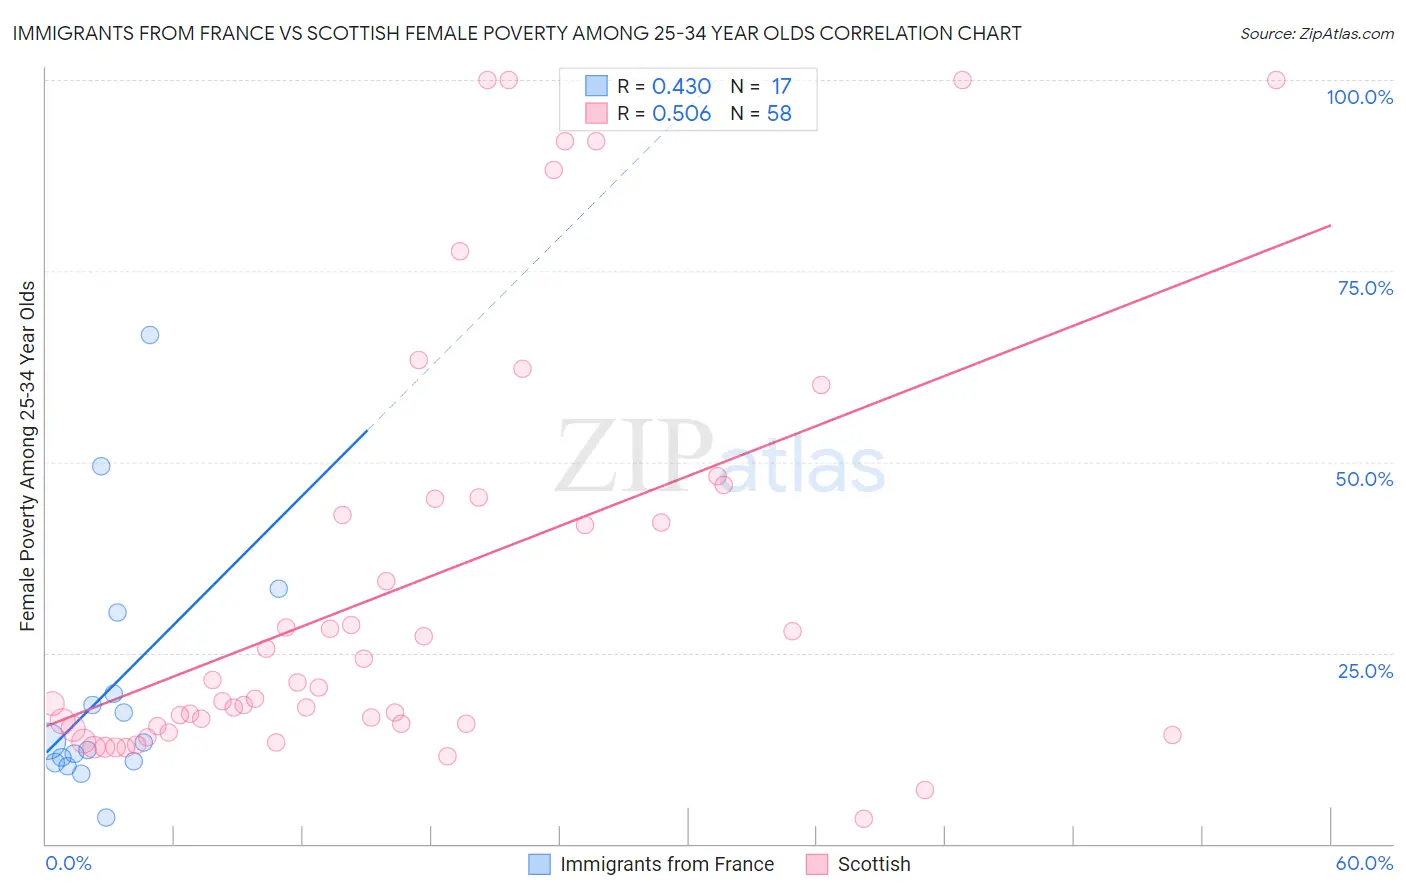
Immigrants from France vs Scottish Female Poverty Among 25-34 Year Olds Correlation Chart
The statistical analysis conducted on geographies consisting of 284,403,921 people shows a moderate positive correlation between the proportion of Immigrants from France and poverty level among females between the ages 25 and 34 in the United States with a correlation coefficient (R) of 0.430 and weighted average of 12.6%. Similarly, the statistical analysis conducted on geographies consisting of 544,896,820 people shows a substantial positive correlation between the proportion of Scottish and poverty level among females between the ages 25 and 34 in the United States with a correlation coefficient (R) of 0.506 and weighted average of 13.9%, a difference of 10.2%.
Female Poverty Among 25-34 Year Olds Correlation Summary
| Measurement | Immigrants from France | Scottish |
| Minimum | 3.4% | 3.2% |
| Maximum | 66.7% | 100.0% |
| Range | 63.3% | 96.8% |
| Mean | 20.1% | 33.8% |
| Median | 13.3% | 19.7% |
| Interquartile 25% (IQ1) | 10.7% | 15.4% |
| Interquartile 75% (IQ3) | 24.9% | 45.2% |
| Interquartile Range (IQR) | 14.2% | 29.9% |
| Standard Deviation (Sample) | 16.4% | 27.8% |
| Standard Deviation (Population) | 15.9% | 27.6% |
Similar Demographics by Female Poverty Among 25-34 Year Olds
Demographics Similar to Immigrants from France by Female Poverty Among 25-34 Year Olds
In terms of female poverty among 25-34 year olds, the demographic groups most similar to Immigrants from France are Ukrainian (12.6%, a difference of 0.040%), Palestinian (12.6%, a difference of 0.050%), Immigrants from Zimbabwe (12.6%, a difference of 0.050%), Immigrants from Armenia (12.6%, a difference of 0.090%), and Norwegian (12.6%, a difference of 0.10%).
| Demographics | Rating | Rank | Female Poverty Among 25-34 Year Olds |
| Argentineans | 97.5 /100 | #87 | Exceptional 12.5% |
| Immigrants | Austria | 97.4 /100 | #88 | Exceptional 12.5% |
| Italians | 97.2 /100 | #89 | Exceptional 12.5% |
| Immigrants | Albania | 97.1 /100 | #90 | Exceptional 12.5% |
| Norwegians | 96.9 /100 | #91 | Exceptional 12.6% |
| Immigrants | Armenia | 96.9 /100 | #92 | Exceptional 12.6% |
| Palestinians | 96.9 /100 | #93 | Exceptional 12.6% |
| Immigrants | France | 96.8 /100 | #94 | Exceptional 12.6% |
| Ukrainians | 96.7 /100 | #95 | Exceptional 12.6% |
| Immigrants | Zimbabwe | 96.7 /100 | #96 | Exceptional 12.6% |
| Immigrants | Northern Africa | 96.6 /100 | #97 | Exceptional 12.6% |
| Immigrants | Ethiopia | 96.5 /100 | #98 | Exceptional 12.6% |
| Immigrants | Argentina | 96.4 /100 | #99 | Exceptional 12.6% |
| Immigrants | Denmark | 95.7 /100 | #100 | Exceptional 12.7% |
| Immigrants | Switzerland | 95.7 /100 | #101 | Exceptional 12.7% |
Demographics Similar to Scottish by Female Poverty Among 25-34 Year Olds
In terms of female poverty among 25-34 year olds, the demographic groups most similar to Scottish are Immigrants from Cambodia (13.9%, a difference of 0.050%), Moroccan (13.8%, a difference of 0.16%), Immigrants from Saudi Arabia (13.9%, a difference of 0.20%), Immigrants from Germany (13.9%, a difference of 0.32%), and English (13.9%, a difference of 0.38%).
| Demographics | Rating | Rank | Female Poverty Among 25-34 Year Olds |
| Finns | 32.5 /100 | #189 | Fair 13.7% |
| Dutch | 29.7 /100 | #190 | Fair 13.8% |
| Immigrants | St. Vincent and the Grenadines | 29.3 /100 | #191 | Fair 13.8% |
| Tlingit-Haida | 28.1 /100 | #192 | Fair 13.8% |
| Immigrants | Kenya | 28.0 /100 | #193 | Fair 13.8% |
| Moroccans | 25.1 /100 | #194 | Fair 13.8% |
| Immigrants | Cambodia | 24.0 /100 | #195 | Fair 13.9% |
| Scottish | 23.6 /100 | #196 | Fair 13.9% |
| Immigrants | Saudi Arabia | 21.9 /100 | #197 | Fair 13.9% |
| Immigrants | Germany | 20.9 /100 | #198 | Fair 13.9% |
| English | 20.4 /100 | #199 | Fair 13.9% |
| Hmong | 20.3 /100 | #200 | Fair 13.9% |
| Immigrants | Trinidad and Tobago | 17.6 /100 | #201 | Poor 14.0% |
| Welsh | 17.2 /100 | #202 | Poor 14.0% |
| Immigrants | Immigrants | 14.5 /100 | #203 | Poor 14.0% |