Guamanian/Chamorro vs Osage Female Poverty Among 25-34 Year Olds

COMPARE

Guamanian/Chamorro
Race
Ancestry
AfghanAfricanAlaska NativeAlaskan AthabascanAlbanianAleutAlsatianAmericanApacheArabArapahoArgentineanArmenianAssyrian/Chaldean/SyriacAustralianAustrianBahamianBangladeshiBarbadianBasqueBelgianBelizeanBermudanBhutaneseBlackfeetBolivianBrazilianBritishBritish West IndianBulgarianBurmeseCajunCambodianCanadianCape VerdeanCarpatho RusynCelticCentral AmericanCentral American IndianCherokeeCheyenneChickasawChileanChineseChippewaChoctawColombianColvilleComancheCosta RicanCreeCreekCroatianCrowCubanCypriotCzechCzechoslovakianDanishDelawareDominicanDutchDutch West IndianEastern EuropeanEcuadorianEgyptianEnglishEstonianEthiopianEuropeanFijianFilipinoFinnishFrenchFrench American IndianFrench CanadianGermanGerman RussianGhanaianGreekGuamanian/ChamorroGuatemalanGuyaneseHaitianHmongHonduranHopiHoumaHungarianIcelanderIndian (Asian)IndonesianInupiatIranianIraqiIrishIroquoisIsraeliItalianJamaicanJapaneseJordanianKenyanKiowaKoreanLaotianLatvianLebaneseLiberianLithuanianLumbeeLuxembourgerMacedonianMalaysianMalteseMarshalleseMenomineeMexicanMexican American IndianMongolianMoroccanNative HawaiianNavajoNepaleseNew ZealanderNicaraguanNigerianNorthern EuropeanNorwegianOkinawanOttawaPaiutePakistaniPalestinianPanamanianParaguayanPennsylvania GermanPeruvianPimaPolishPortuguesePotawatomiPuebloPuerto RicanPuget Sound SalishRomanianRussianSalvadoranSamoanScandinavianScotch-IrishScottishSeminoleSenegaleseSerbianShoshoneSierra LeoneanSiouxSlavicSlovakSloveneSomaliSouth AfricanSouth AmericanSouth American IndianSoviet UnionSpaniardSpanishSpanish AmericanSpanish American IndianSri LankanSubsaharan AfricanSudaneseSwedishSwissSyrianTaiwaneseThaiTlingit-HaidaTohono O'OdhamTonganTrinidadian and TobagonianTsimshianTurkishU.S. Virgin IslanderUgandanUkrainianUruguayanUteVenezuelanVietnameseWelshWest IndianYakamaYaquiYugoslavianYumanYup'ikZimbabwean
Immigration
NonimmigrantsImmigrantsAfghanistanAfricaAlbaniaArgentinaArmeniaAsiaAustraliaAustriaBahamasBangladeshBarbadosBelarusBelgiumBelizeBoliviaBosnia and HerzegovinaBrazilBulgariaBurma/MyanmarCabo VerdeCambodiaCameroonCanadaCaribbeanCentral AmericaChileChinaColombiaCongoCosta RicaCroatiaCubaCzechoslovakiaDenmarkDominicaDominican RepublicEastern AfricaEastern AsiaEastern EuropeEcuadorEgyptEl SalvadorEnglandEritreaEthiopiaEuropeFijiFranceGermanyGhanaGreeceGrenadaGuatemalaGuyanaHaitiHondurasHong KongHungaryIndiaIndonesiaIranIraqIrelandIsraelItalyJamaicaJapanJordanKazakhstanKenyaKoreaKuwaitLaosLatin AmericaLatviaLebanonLiberiaLithuaniaMalaysiaMexicoMicronesiaMiddle AfricaMoldovaMoroccoNepalNetherlandsNicaraguaNigeriaNorth AmericaNorth MacedoniaNorthern AfricaNorthern EuropeNorwayOceaniaPakistanPanamaPeruPhilippinesPolandPortugalRomaniaRussiaSaudi ArabiaScotlandSenegalSerbiaSierra LeoneSingaporeSomaliaSouth AfricaSouth AmericaSouth Central AsiaSouth Eastern AsiaSouthern EuropeSpainSri LankaSt. Vincent and the GrenadinesSudanSwedenSwitzerlandSyriaTaiwanThailandTrinidad and TobagoTurkeyUgandaUkraineUruguayUzbekistanVenezuelaVietnamWest IndiesWestern AfricaWestern AsiaWestern EuropeYemenZaireZimbabweAzores
Osage
Race
Ancestry
AfghanAfricanAlaska NativeAlaskan AthabascanAlbanianAleutAlsatianAmericanApacheArabArapahoArgentineanArmenianAssyrian/Chaldean/SyriacAustralianAustrianBahamianBangladeshiBarbadianBasqueBelgianBelizeanBermudanBhutaneseBlackfeetBolivianBrazilianBritishBritish West IndianBulgarianBurmeseCajunCambodianCanadianCape VerdeanCarpatho RusynCelticCentral AmericanCentral American IndianCherokeeCheyenneChickasawChileanChineseChippewaChoctawColombianColvilleComancheCosta RicanCreeCreekCroatianCrowCubanCypriotCzechCzechoslovakianDanishDelawareDominicanDutchDutch West IndianEastern EuropeanEcuadorianEgyptianEnglishEstonianEthiopianEuropeanFijianFilipinoFinnishFrenchFrench American IndianFrench CanadianGermanGerman RussianGhanaianGreekGuatemalanGuyaneseHaitianHmongHonduranHopiHoumaHungarianIcelanderIndian (Asian)IndonesianInupiatIranianIraqiIrishIroquoisIsraeliItalianJamaicanJapaneseJordanianKenyanKiowaKoreanLaotianLatvianLebaneseLiberianLithuanianLumbeeLuxembourgerMacedonianMalaysianMalteseMarshalleseMenomineeMexicanMexican American IndianMongolianMoroccanNative HawaiianNavajoNepaleseNew ZealanderNicaraguanNigerianNorthern EuropeanNorwegianOkinawanOsageOttawaPaiutePakistaniPalestinianPanamanianParaguayanPennsylvania GermanPeruvianPimaPolishPortuguesePotawatomiPuebloPuerto RicanPuget Sound SalishRomanianRussianSalvadoranSamoanScandinavianScotch-IrishScottishSeminoleSenegaleseSerbianShoshoneSierra LeoneanSiouxSlavicSlovakSloveneSomaliSouth AfricanSouth AmericanSouth American IndianSoviet UnionSpaniardSpanishSpanish AmericanSpanish American IndianSri LankanSubsaharan AfricanSudaneseSwedishSwissSyrianTaiwaneseThaiTlingit-HaidaTohono O'OdhamTonganTrinidadian and TobagonianTsimshianTurkishU.S. Virgin IslanderUgandanUkrainianUruguayanUteVenezuelanVietnameseWelshWest IndianYakamaYaquiYugoslavianYumanYup'ikZimbabwean
Immigration
NonimmigrantsImmigrantsAfghanistanAfricaAlbaniaArgentinaArmeniaAsiaAustraliaAustriaBahamasBangladeshBarbadosBelarusBelgiumBelizeBoliviaBosnia and HerzegovinaBrazilBulgariaBurma/MyanmarCabo VerdeCambodiaCameroonCanadaCaribbeanCentral AmericaChileChinaColombiaCongoCosta RicaCroatiaCubaCzechoslovakiaDenmarkDominicaDominican RepublicEastern AfricaEastern AsiaEastern EuropeEcuadorEgyptEl SalvadorEnglandEritreaEthiopiaEuropeFijiFranceGermanyGhanaGreeceGrenadaGuatemalaGuyanaHaitiHondurasHong KongHungaryIndiaIndonesiaIranIraqIrelandIsraelItalyJamaicaJapanJordanKazakhstanKenyaKoreaKuwaitLaosLatin AmericaLatviaLebanonLiberiaLithuaniaMalaysiaMexicoMicronesiaMiddle AfricaMoldovaMoroccoNepalNetherlandsNicaraguaNigeriaNorth AmericaNorth MacedoniaNorthern AfricaNorthern EuropeNorwayOceaniaPakistanPanamaPeruPhilippinesPolandPortugalRomaniaRussiaSaudi ArabiaScotlandSenegalSerbiaSierra LeoneSingaporeSomaliaSouth AfricaSouth AmericaSouth Central AsiaSouth Eastern AsiaSouthern EuropeSpainSri LankaSt. Vincent and the GrenadinesSudanSwedenSwitzerlandSyriaTaiwanThailandTrinidad and TobagoTurkeyUgandaUkraineUruguayUzbekistanVenezuelaVietnamWest IndiesWestern AfricaWestern AsiaWestern EuropeYemenZaireZimbabweAzores
Female Poverty Among 25-34 Year Olds
Income
Poverty
Unemployment
Labor Participation
Family Structure
Vehicle Availability
Education Level
Disability

Female Poverty Among 25-34 Year Olds Comparison

Guamanians/Chamorros

Osage

Average
Tragic
13.6%
FEMALE POVERTY AMONG 25-34 YEAR OLDS
41.5/ 100
METRIC RATING
181st/ 347
METRIC RANK
16.4%
FEMALE POVERTY AMONG 25-34 YEAR OLDS
0.0/ 100
METRIC RATING
289th/ 347
METRIC RANK

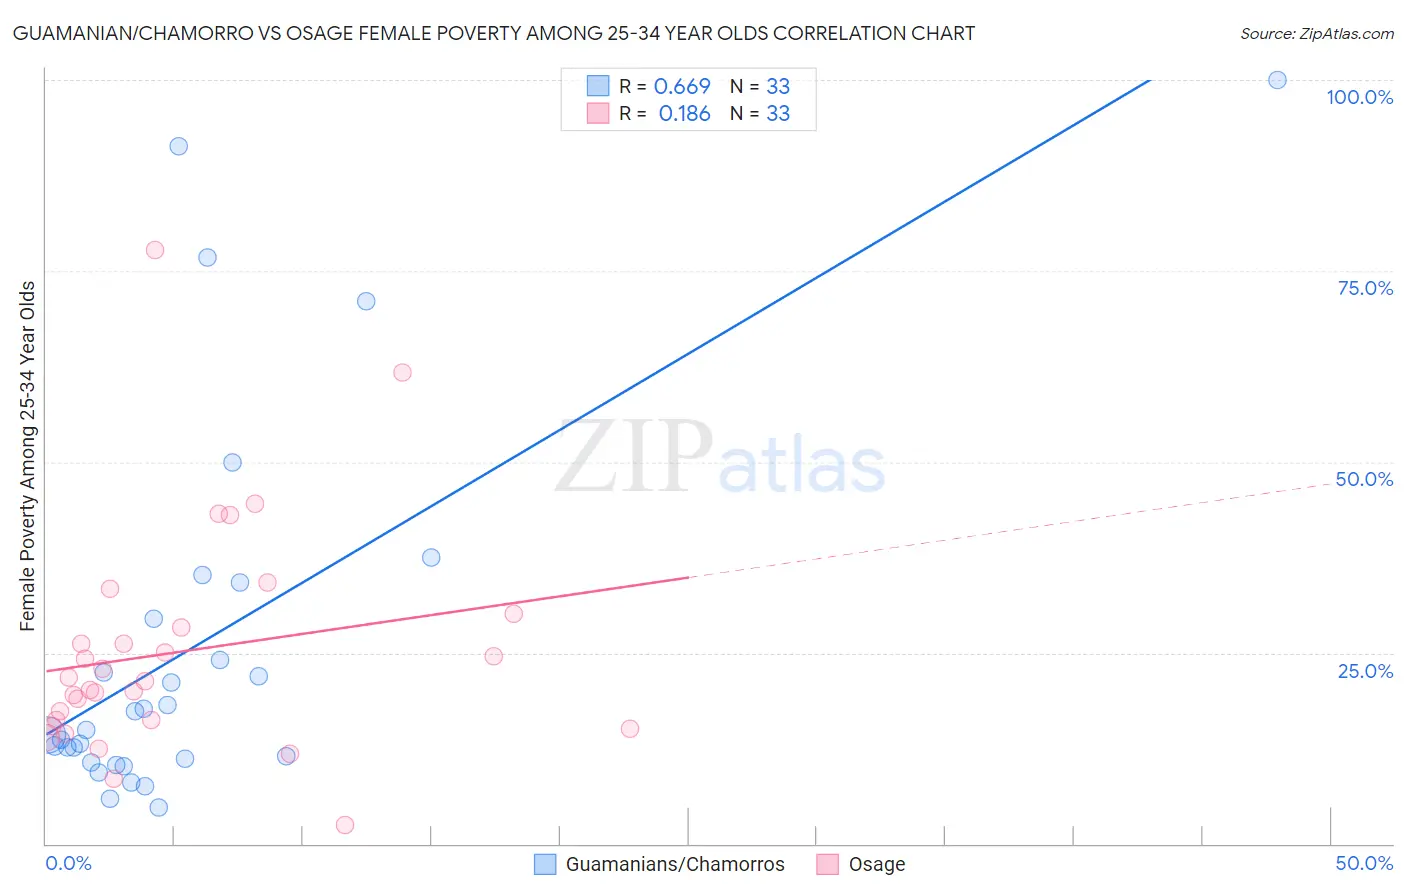
Guamanian/Chamorro vs Osage Female Poverty Among 25-34 Year Olds Correlation Chart

The statistical analysis conducted on geographies consisting of 220,375,299 people shows a significant positive correlation between the proportion of Guamanians/Chamorros and poverty level among females between the ages 25 and 34 in the United States with a correlation coefficient (R) of 0.669 and weighted average of 13.6%. Similarly, the statistical analysis conducted on geographies consisting of 91,487,860 people shows a poor positive correlation between the proportion of Osage and poverty level among females between the ages 25 and 34 in the United States with a correlation coefficient (R) of 0.186 and weighted average of 16.4%, a difference of 20.3%.
Guamanian/Chamorro vs Osage Female Poverty Among 25-34 Year Olds

Female Poverty Among 25-34 Year Olds Correlation Summary

MeasurementGuamanian/ChamorroOsage
Minimum4.8%2.4%
Maximum100.0%77.8%
Range95.2%75.3%
Mean25.8%25.2%
Median14.8%21.3%
Interquartile 25% (IQ1)10.9%15.8%
Interquartile 75% (IQ3)31.8%29.3%
Interquartile Range (IQR)20.9%13.5%
Standard Deviation (Sample)24.7%15.1%
Standard Deviation (Population)24.3%14.9%

Similar Demographics by Female Poverty Among 25-34 Year Olds

Demographics Similar to Guamanians/Chamorros by Female Poverty Among 25-34 Year Olds

In terms of female poverty among 25-34 year olds, the demographic groups most similar to Guamanians/Chamorros are German (13.6%, a difference of 0.010%), Immigrants from Venezuela (13.6%, a difference of 0.070%), Portuguese (13.6%, a difference of 0.10%), Immigrants from Eastern Africa (13.6%, a difference of 0.17%), and Canadian (13.6%, a difference of 0.24%).
DemographicsRating | RankFemale Poverty Among 25-34 Year Olds
Immigrants | Oceania
50.0
/100
|
#174
Average
13.5%
Bermudans
46.8
/100
|
#175
Average
13.6%
Yugoslavians
45.0
/100
|
#176
Average
13.6%
Venezuelans
44.6
/100
|
#177
Average
13.6%
Canadians
44.3
/100
|
#178
Average
13.6%
Immigrants | Eastern Africa
43.6
/100
|
#179
Average
13.6%
Germans
41.6
/100
|
#180
Average
13.6%
Guamanians/Chamorros
41.5
/100
|
#181
Average
13.6%
Immigrants | Venezuela
40.7
/100
|
#182
Average
13.6%
Portuguese
40.3
/100
|
#183
Average
13.6%
Czechoslovakians
36.8
/100
|
#184
Fair
13.7%
Irish
35.3
/100
|
#185
Fair
13.7%
Immigrants | Uruguay
34.1
/100
|
#186
Fair
13.7%
Slovaks
34.1
/100
|
#187
Fair
13.7%
Immigrants | Eritrea
32.7
/100
|
#188
Fair
13.7%

Demographics Similar to Osage by Female Poverty Among 25-34 Year Olds

In terms of female poverty among 25-34 year olds, the demographic groups most similar to Osage are Guatemalan (16.4%, a difference of 0.060%), Indonesian (16.4%, a difference of 0.16%), American (16.4%, a difference of 0.25%), Cape Verdean (16.3%, a difference of 0.30%), and Comanche (16.5%, a difference of 0.44%).
DemographicsRating | RankFemale Poverty Among 25-34 Year Olds
Aleuts
0.0
/100
|
#282
Tragic
16.1%
Bahamians
0.0
/100
|
#283
Tragic
16.1%
Shoshone
0.0
/100
|
#284
Tragic
16.2%
Immigrants | Bahamas
0.0
/100
|
#285
Tragic
16.3%
Cape Verdeans
0.0
/100
|
#286
Tragic
16.3%
Americans
0.0
/100
|
#287
Tragic
16.4%
Guatemalans
0.0
/100
|
#288
Tragic
16.4%
Osage
0.0
/100
|
#289
Tragic
16.4%
Indonesians
0.0
/100
|
#290
Tragic
16.4%
Comanche
0.0
/100
|
#291
Tragic
16.5%
Immigrants | Dominica
0.0
/100
|
#292
Tragic
16.5%
Potawatomi
0.0
/100
|
#293
Tragic
16.5%
Immigrants | Central America
0.0
/100
|
#294
Tragic
16.6%
Mexicans
0.0
/100
|
#295
Tragic
16.6%
Hispanics or Latinos
0.0
/100
|
#296
Tragic
16.6%