Immigrants from Albania vs Immigrants from Trinidad and Tobago Child Poverty Under the Age of 5
COMPARE
Immigrants from Albania
Immigrants from Trinidad and Tobago
Child Poverty Under the Age of 5
Child Poverty Under the Age of 5 Comparison
Immigrants from Albania
Immigrants from Trinidad and Tobago
16.2%
CHILD POVERTY UNDER THE AGE OF 5
91.8/ 100
METRIC RATING
126th/ 347
METRIC RANK
19.4%
CHILD POVERTY UNDER THE AGE OF 5
0.8/ 100
METRIC RATING
236th/ 347
METRIC RANK
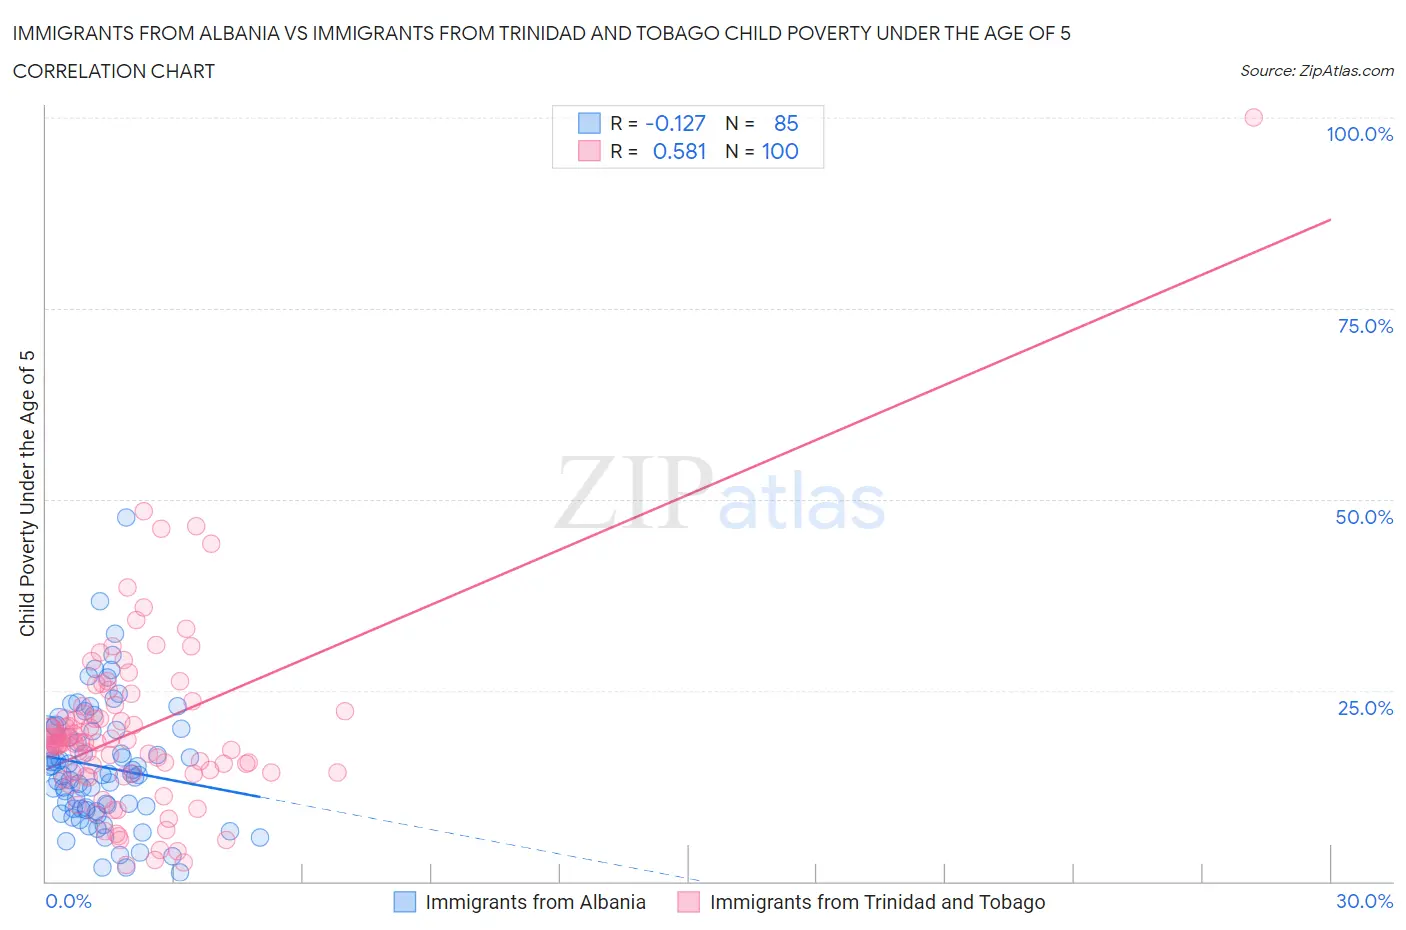
Immigrants from Albania vs Immigrants from Trinidad and Tobago Child Poverty Under the Age of 5 Correlation Chart
The statistical analysis conducted on geographies consisting of 116,596,998 people shows a poor negative correlation between the proportion of Immigrants from Albania and poverty level among children under the age of 5 in the United States with a correlation coefficient (R) of -0.127 and weighted average of 16.2%. Similarly, the statistical analysis conducted on geographies consisting of 218,090,061 people shows a substantial positive correlation between the proportion of Immigrants from Trinidad and Tobago and poverty level among children under the age of 5 in the United States with a correlation coefficient (R) of 0.581 and weighted average of 19.4%, a difference of 20.1%.
Child Poverty Under the Age of 5 Correlation Summary
| Measurement | Immigrants from Albania | Immigrants from Trinidad and Tobago |
| Minimum | 1.1% | 2.2% |
| Maximum | 47.7% | 100.0% |
| Range | 46.5% | 97.8% |
| Mean | 15.0% | 19.7% |
| Median | 14.0% | 18.1% |
| Interquartile 25% (IQ1) | 9.5% | 14.1% |
| Interquartile 75% (IQ3) | 19.7% | 22.6% |
| Interquartile Range (IQR) | 10.2% | 8.5% |
| Standard Deviation (Sample) | 8.1% | 12.4% |
| Standard Deviation (Population) | 8.0% | 12.3% |
Similar Demographics by Child Poverty Under the Age of 5
Demographics Similar to Immigrants from Albania by Child Poverty Under the Age of 5
In terms of child poverty under the age of 5, the demographic groups most similar to Immigrants from Albania are Native Hawaiian (16.2%, a difference of 0.0%), Austrian (16.1%, a difference of 0.080%), Swiss (16.1%, a difference of 0.080%), Immigrants from England (16.2%, a difference of 0.080%), and Immigrants from Southern Europe (16.1%, a difference of 0.11%).
| Demographics | Rating | Rank | Child Poverty Under the Age of 5 |
| Immigrants | Jordan | 93.2 /100 | #119 | Exceptional 16.1% |
| Immigrants | Peru | 92.6 /100 | #120 | Exceptional 16.1% |
| Mongolians | 92.5 /100 | #121 | Exceptional 16.1% |
| Immigrants | Southern Europe | 92.0 /100 | #122 | Exceptional 16.1% |
| Austrians | 92.0 /100 | #123 | Exceptional 16.1% |
| Swiss | 92.0 /100 | #124 | Exceptional 16.1% |
| Native Hawaiians | 91.8 /100 | #125 | Exceptional 16.2% |
| Immigrants | Albania | 91.8 /100 | #126 | Exceptional 16.2% |
| Immigrants | England | 91.5 /100 | #127 | Exceptional 16.2% |
| South Africans | 90.1 /100 | #128 | Exceptional 16.2% |
| British | 89.4 /100 | #129 | Excellent 16.3% |
| Immigrants | Norway | 89.3 /100 | #130 | Excellent 16.3% |
| Finns | 88.3 /100 | #131 | Excellent 16.3% |
| Serbians | 88.2 /100 | #132 | Excellent 16.3% |
| Icelanders | 87.9 /100 | #133 | Excellent 16.3% |
Demographics Similar to Immigrants from Trinidad and Tobago by Child Poverty Under the Age of 5
In terms of child poverty under the age of 5, the demographic groups most similar to Immigrants from Trinidad and Tobago are Immigrants from Laos (19.4%, a difference of 0.0%), Immigrants from Micronesia (19.4%, a difference of 0.21%), Sudanese (19.3%, a difference of 0.34%), Trinidadian and Tobagonian (19.3%, a difference of 0.39%), and Immigrants from Cabo Verde (19.5%, a difference of 0.55%).
| Demographics | Rating | Rank | Child Poverty Under the Age of 5 |
| Ghanaians | 1.2 /100 | #229 | Tragic 19.2% |
| Ecuadorians | 1.2 /100 | #230 | Tragic 19.2% |
| Bermudans | 1.2 /100 | #231 | Tragic 19.2% |
| Trinidadians and Tobagonians | 0.9 /100 | #232 | Tragic 19.3% |
| Sudanese | 0.9 /100 | #233 | Tragic 19.3% |
| Immigrants | Micronesia | 0.9 /100 | #234 | Tragic 19.4% |
| Immigrants | Laos | 0.8 /100 | #235 | Tragic 19.4% |
| Immigrants | Trinidad and Tobago | 0.8 /100 | #236 | Tragic 19.4% |
| Immigrants | Cabo Verde | 0.6 /100 | #237 | Tragic 19.5% |
| Salvadorans | 0.6 /100 | #238 | Tragic 19.5% |
| Vietnamese | 0.6 /100 | #239 | Tragic 19.5% |
| Immigrants | Ecuador | 0.5 /100 | #240 | Tragic 19.6% |
| Alaska Natives | 0.5 /100 | #241 | Tragic 19.6% |
| Immigrants | Guyana | 0.5 /100 | #242 | Tragic 19.6% |
| Osage | 0.5 /100 | #243 | Tragic 19.6% |