Hmong vs Immigrants from Trinidad and Tobago Child Poverty Under the Age of 5
COMPARE
Hmong
Immigrants from Trinidad and Tobago
Child Poverty Under the Age of 5
Child Poverty Under the Age of 5 Comparison
Hmong
Immigrants from Trinidad and Tobago
18.5%
CHILD POVERTY UNDER THE AGE OF 5
5.0/ 100
METRIC RATING
216th/ 347
METRIC RANK
19.4%
CHILD POVERTY UNDER THE AGE OF 5
0.8/ 100
METRIC RATING
236th/ 347
METRIC RANK
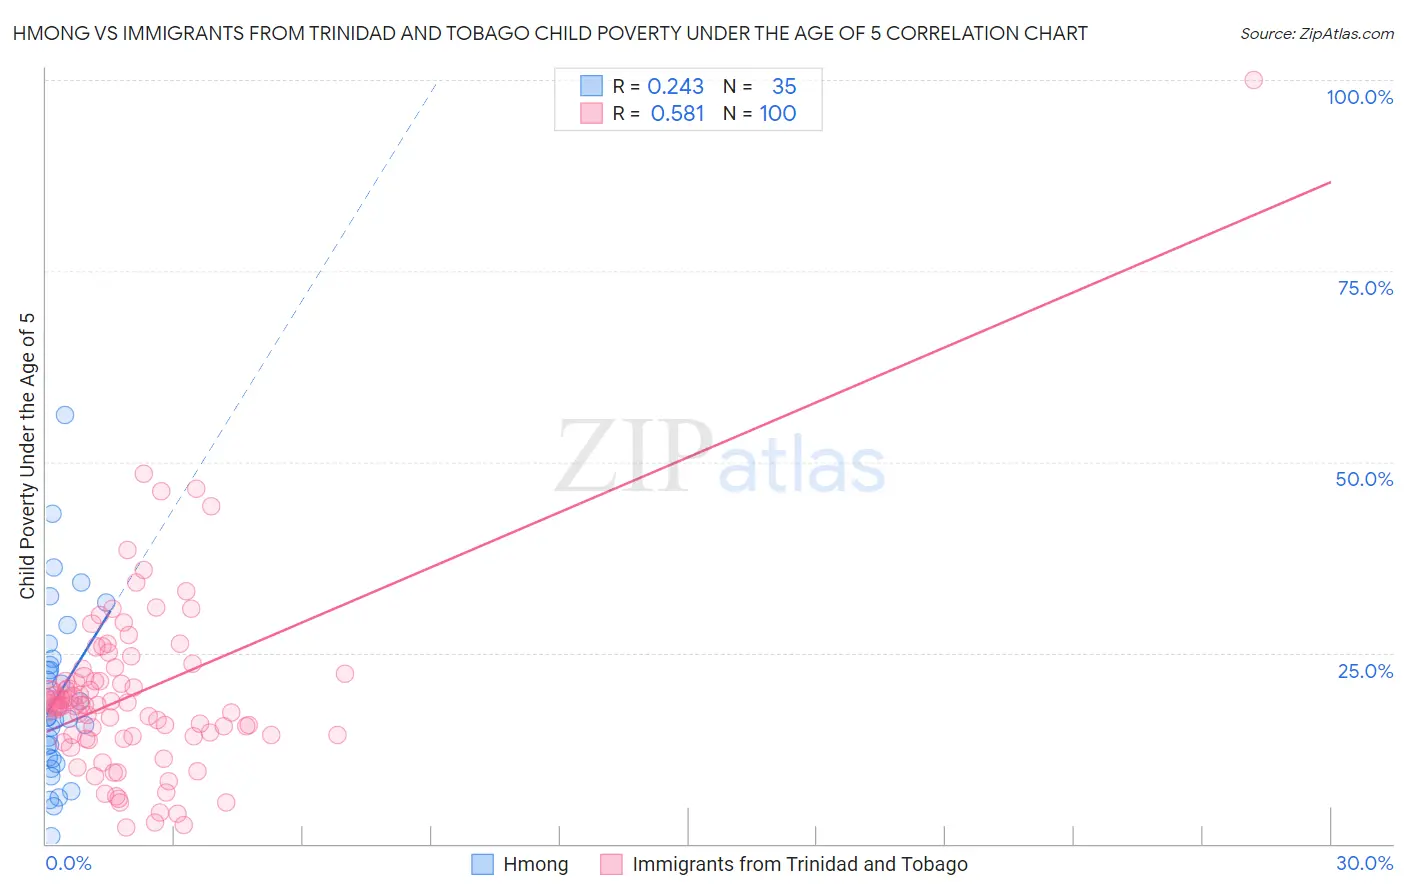
Hmong vs Immigrants from Trinidad and Tobago Child Poverty Under the Age of 5 Correlation Chart
The statistical analysis conducted on geographies consisting of 24,630,682 people shows a weak positive correlation between the proportion of Hmong and poverty level among children under the age of 5 in the United States with a correlation coefficient (R) of 0.243 and weighted average of 18.5%. Similarly, the statistical analysis conducted on geographies consisting of 218,090,061 people shows a substantial positive correlation between the proportion of Immigrants from Trinidad and Tobago and poverty level among children under the age of 5 in the United States with a correlation coefficient (R) of 0.581 and weighted average of 19.4%, a difference of 4.6%.
Child Poverty Under the Age of 5 Correlation Summary
| Measurement | Hmong | Immigrants from Trinidad and Tobago |
| Minimum | 0.91% | 2.2% |
| Maximum | 56.2% | 100.0% |
| Range | 55.3% | 97.8% |
| Mean | 19.2% | 19.7% |
| Median | 16.5% | 18.1% |
| Interquartile 25% (IQ1) | 11.1% | 14.1% |
| Interquartile 75% (IQ3) | 24.2% | 22.6% |
| Interquartile Range (IQR) | 13.2% | 8.5% |
| Standard Deviation (Sample) | 11.6% | 12.4% |
| Standard Deviation (Population) | 11.5% | 12.3% |
Demographics Similar to Hmong and Immigrants from Trinidad and Tobago by Child Poverty Under the Age of 5
In terms of child poverty under the age of 5, the demographic groups most similar to Hmong are Immigrants from Africa (18.6%, a difference of 0.20%), Delaware (18.7%, a difference of 0.95%), German Russian (18.8%, a difference of 1.3%), Immigrants from the Azores (18.9%, a difference of 1.6%), and Immigrants from Nigeria (19.0%, a difference of 2.2%). Similarly, the demographic groups most similar to Immigrants from Trinidad and Tobago are Immigrants from Laos (19.4%, a difference of 0.0%), Immigrants from Micronesia (19.4%, a difference of 0.21%), Sudanese (19.3%, a difference of 0.34%), Trinidadian and Tobagonian (19.3%, a difference of 0.39%), and Bermudan (19.2%, a difference of 0.96%).
| Demographics | Rating | Rank | Child Poverty Under the Age of 5 |
| Hmong | 5.0 /100 | #216 | Tragic 18.5% |
| Immigrants | Africa | 4.6 /100 | #217 | Tragic 18.6% |
| Delaware | 3.4 /100 | #218 | Tragic 18.7% |
| German Russians | 3.0 /100 | #219 | Tragic 18.8% |
| Immigrants | Azores | 2.6 /100 | #220 | Tragic 18.9% |
| Immigrants | Nigeria | 2.1 /100 | #221 | Tragic 19.0% |
| Alsatians | 1.7 /100 | #222 | Tragic 19.1% |
| Cubans | 1.7 /100 | #223 | Tragic 19.1% |
| Nicaraguans | 1.6 /100 | #224 | Tragic 19.1% |
| Nigerians | 1.6 /100 | #225 | Tragic 19.1% |
| Immigrants | Eritrea | 1.5 /100 | #226 | Tragic 19.1% |
| Cape Verdeans | 1.4 /100 | #227 | Tragic 19.1% |
| Immigrants | Sudan | 1.3 /100 | #228 | Tragic 19.2% |
| Ghanaians | 1.2 /100 | #229 | Tragic 19.2% |
| Ecuadorians | 1.2 /100 | #230 | Tragic 19.2% |
| Bermudans | 1.2 /100 | #231 | Tragic 19.2% |
| Trinidadians and Tobagonians | 0.9 /100 | #232 | Tragic 19.3% |
| Sudanese | 0.9 /100 | #233 | Tragic 19.3% |
| Immigrants | Micronesia | 0.9 /100 | #234 | Tragic 19.4% |
| Immigrants | Laos | 0.8 /100 | #235 | Tragic 19.4% |
| Immigrants | Trinidad and Tobago | 0.8 /100 | #236 | Tragic 19.4% |