Immigrants from Yemen vs Bahamian Single Mother Poverty
COMPARE
Immigrants from Yemen
Bahamian
Single Mother Poverty
Single Mother Poverty Comparison
Immigrants from Yemen
Bahamians
38.5%
SINGLE MOTHER POVERTY
0.0/ 100
METRIC RATING
337th/ 347
METRIC RANK
31.3%
SINGLE MOTHER POVERTY
0.2/ 100
METRIC RATING
263rd/ 347
METRIC RANK
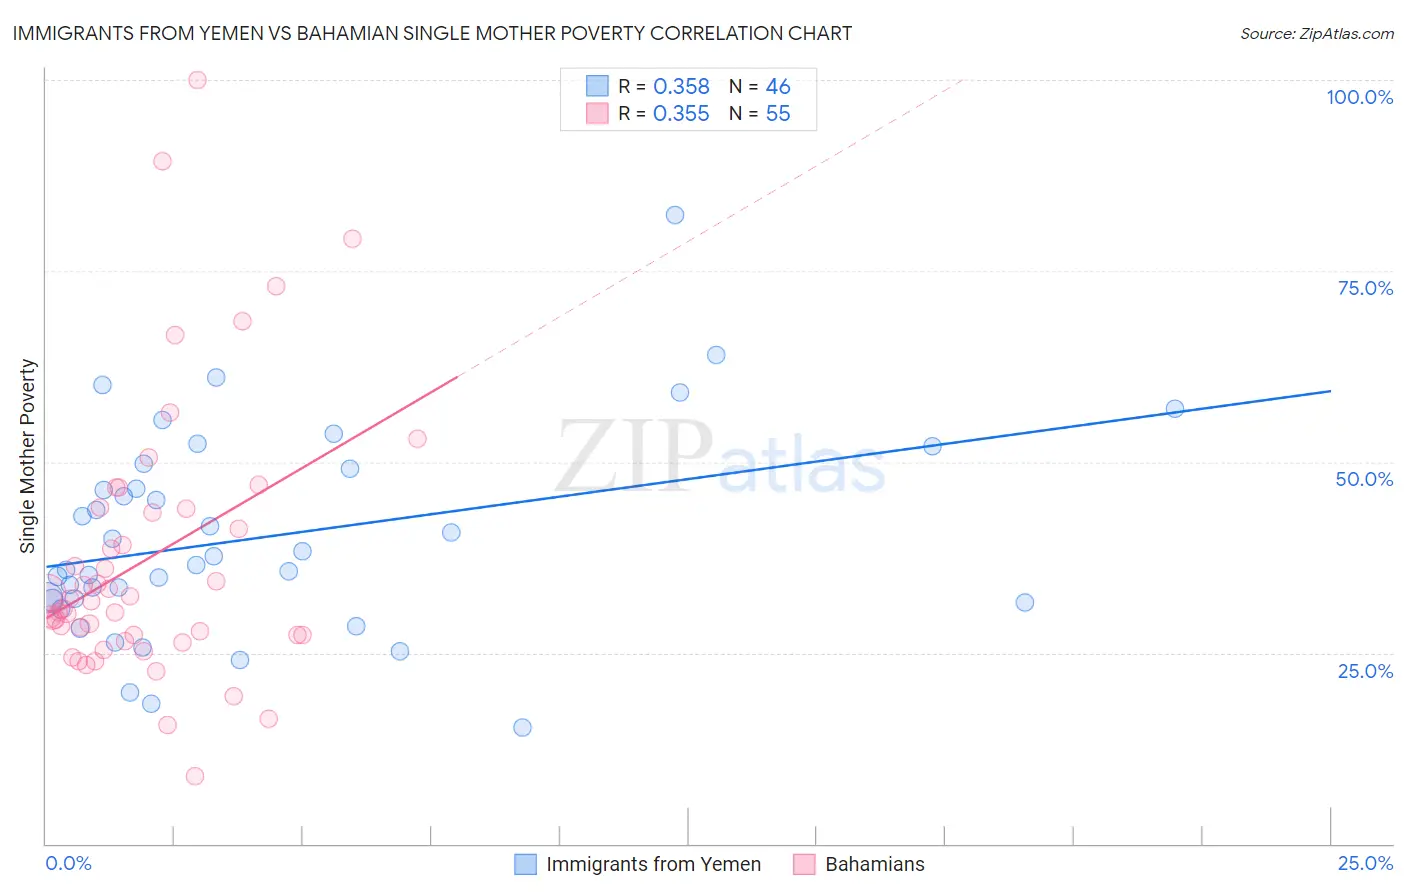
Immigrants from Yemen vs Bahamian Single Mother Poverty Correlation Chart
The statistical analysis conducted on geographies consisting of 82,094,093 people shows a mild positive correlation between the proportion of Immigrants from Yemen and poverty level among single mothers in the United States with a correlation coefficient (R) of 0.358 and weighted average of 38.5%. Similarly, the statistical analysis conducted on geographies consisting of 111,917,483 people shows a mild positive correlation between the proportion of Bahamians and poverty level among single mothers in the United States with a correlation coefficient (R) of 0.355 and weighted average of 31.3%, a difference of 22.9%.
Single Mother Poverty Correlation Summary
| Measurement | Immigrants from Yemen | Bahamian |
| Minimum | 15.2% | 8.9% |
| Maximum | 82.4% | 100.0% |
| Range | 67.2% | 91.1% |
| Mean | 40.2% | 37.3% |
| Median | 37.0% | 31.8% |
| Interquartile 25% (IQ1) | 31.9% | 27.3% |
| Interquartile 75% (IQ3) | 49.1% | 43.8% |
| Interquartile Range (IQR) | 17.3% | 16.6% |
| Standard Deviation (Sample) | 13.5% | 17.9% |
| Standard Deviation (Population) | 13.3% | 17.8% |
Similar Demographics by Single Mother Poverty
Demographics Similar to Immigrants from Yemen by Single Mother Poverty
In terms of single mother poverty, the demographic groups most similar to Immigrants from Yemen are Cheyenne (38.5%, a difference of 0.040%), Pima (38.6%, a difference of 0.21%), Crow (38.6%, a difference of 0.30%), Sioux (38.8%, a difference of 0.70%), and Yuman (37.8%, a difference of 2.0%).
| Demographics | Rating | Rank | Single Mother Poverty |
| Natives/Alaskans | 0.0 /100 | #330 | Tragic 36.6% |
| Creek | 0.0 /100 | #331 | Tragic 36.7% |
| Dutch West Indians | 0.0 /100 | #332 | Tragic 36.8% |
| Menominee | 0.0 /100 | #333 | Tragic 37.1% |
| Pueblo | 0.0 /100 | #334 | Tragic 37.2% |
| Yuman | 0.0 /100 | #335 | Tragic 37.8% |
| Cheyenne | 0.0 /100 | #336 | Tragic 38.5% |
| Immigrants | Yemen | 0.0 /100 | #337 | Tragic 38.5% |
| Pima | 0.0 /100 | #338 | Tragic 38.6% |
| Crow | 0.0 /100 | #339 | Tragic 38.6% |
| Sioux | 0.0 /100 | #340 | Tragic 38.8% |
| Colville | 0.0 /100 | #341 | Tragic 39.3% |
| Navajo | 0.0 /100 | #342 | Tragic 40.2% |
| Cajuns | 0.0 /100 | #343 | Tragic 40.3% |
| Tohono O'odham | 0.0 /100 | #344 | Tragic 43.0% |
Demographics Similar to Bahamians by Single Mother Poverty
In terms of single mother poverty, the demographic groups most similar to Bahamians are Immigrants from Ecuador (31.3%, a difference of 0.020%), German Russian (31.3%, a difference of 0.040%), Subsaharan African (31.4%, a difference of 0.11%), Immigrants from Belize (31.4%, a difference of 0.26%), and Hmong (31.2%, a difference of 0.27%).
| Demographics | Rating | Rank | Single Mother Poverty |
| Immigrants | West Indies | 0.4 /100 | #256 | Tragic 31.1% |
| Immigrants | Bahamas | 0.4 /100 | #257 | Tragic 31.1% |
| Immigrants | Caribbean | 0.4 /100 | #258 | Tragic 31.1% |
| Immigrants | Bangladesh | 0.4 /100 | #259 | Tragic 31.1% |
| Whites/Caucasians | 0.3 /100 | #260 | Tragic 31.2% |
| Immigrants | El Salvador | 0.3 /100 | #261 | Tragic 31.2% |
| Hmong | 0.3 /100 | #262 | Tragic 31.2% |
| Bahamians | 0.2 /100 | #263 | Tragic 31.3% |
| Immigrants | Ecuador | 0.2 /100 | #264 | Tragic 31.3% |
| German Russians | 0.2 /100 | #265 | Tragic 31.3% |
| Sub-Saharan Africans | 0.2 /100 | #266 | Tragic 31.4% |
| Immigrants | Belize | 0.2 /100 | #267 | Tragic 31.4% |
| Immigrants | Senegal | 0.1 /100 | #268 | Tragic 31.5% |
| Scotch-Irish | 0.1 /100 | #269 | Tragic 31.5% |
| British West Indians | 0.1 /100 | #270 | Tragic 31.5% |