Yakama vs Immigrants from Moldova Family Poverty
COMPARE
Yakama
Immigrants from Moldova
Family Poverty
Family Poverty Comparison
Yakama
Immigrants from Moldova
13.1%
FAMILY POVERTY
0.0/ 100
METRIC RATING
327th/ 347
METRIC RANK
7.7%
FAMILY POVERTY
98.8/ 100
METRIC RATING
51st/ 347
METRIC RANK
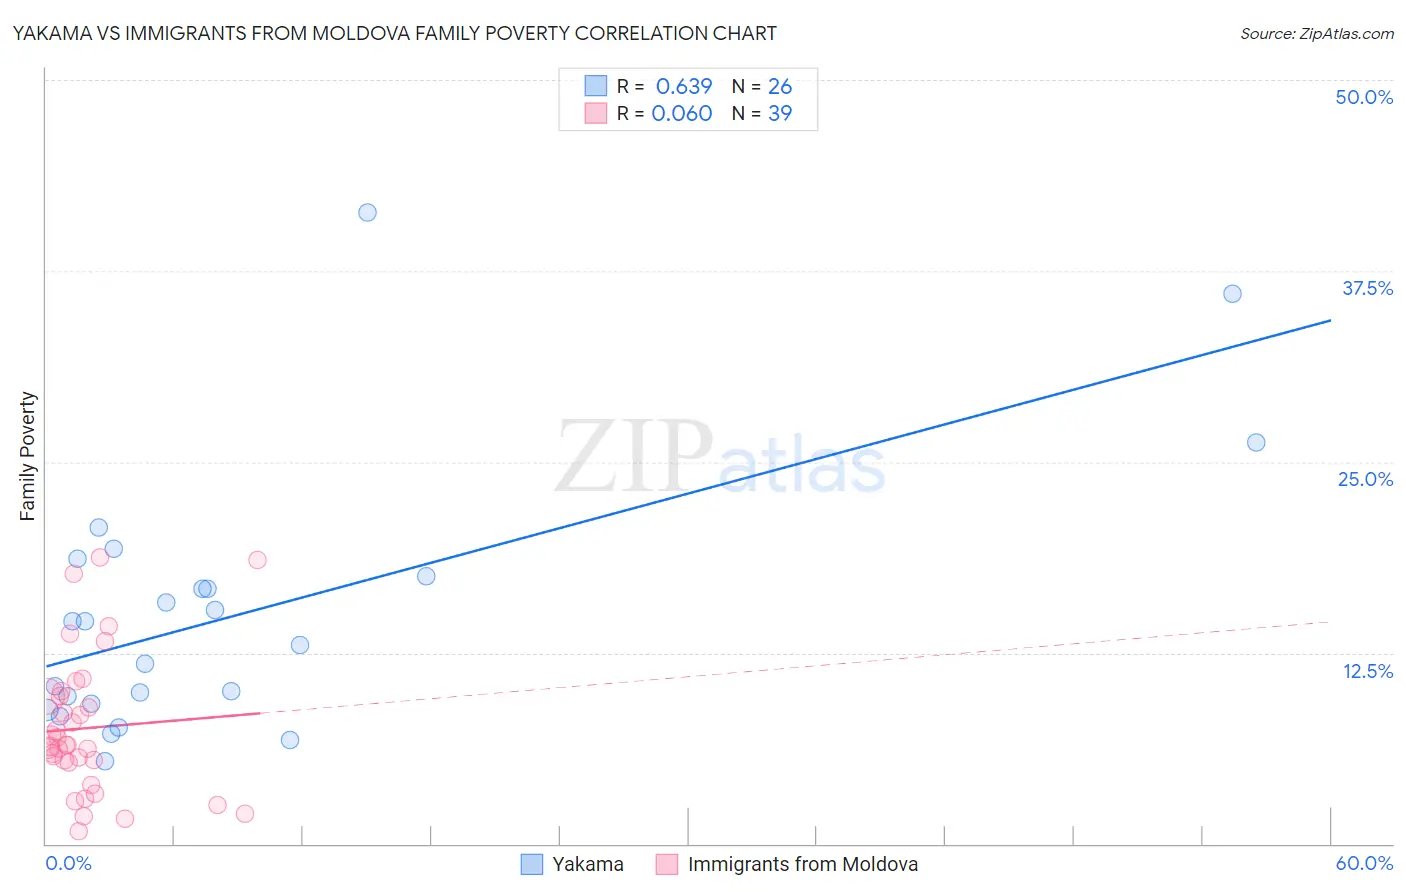
Yakama vs Immigrants from Moldova Family Poverty Correlation Chart
The statistical analysis conducted on geographies consisting of 19,913,351 people shows a significant positive correlation between the proportion of Yakama and poverty level among families in the United States with a correlation coefficient (R) of 0.639 and weighted average of 13.1%. Similarly, the statistical analysis conducted on geographies consisting of 124,316,177 people shows a slight positive correlation between the proportion of Immigrants from Moldova and poverty level among families in the United States with a correlation coefficient (R) of 0.060 and weighted average of 7.7%, a difference of 70.0%.
Family Poverty Correlation Summary
| Measurement | Yakama | Immigrants from Moldova |
| Minimum | 5.4% | 0.83% |
| Maximum | 41.3% | 18.7% |
| Range | 35.9% | 17.9% |
| Mean | 15.1% | 7.6% |
| Median | 13.8% | 6.4% |
| Interquartile 25% (IQ1) | 9.1% | 5.3% |
| Interquartile 75% (IQ3) | 17.5% | 9.6% |
| Interquartile Range (IQR) | 8.4% | 4.3% |
| Standard Deviation (Sample) | 8.6% | 4.5% |
| Standard Deviation (Population) | 8.4% | 4.5% |
Similar Demographics by Family Poverty
Demographics Similar to Yakama by Family Poverty
In terms of family poverty, the demographic groups most similar to Yakama are Colville (13.0%, a difference of 0.68%), Paiute (13.0%, a difference of 0.75%), Central American Indian (13.3%, a difference of 1.7%), Black/African American (13.3%, a difference of 1.8%), and Immigrants from Dominica (12.7%, a difference of 2.7%).
| Demographics | Rating | Rank | Family Poverty |
| Inupiat | 0.0 /100 | #320 | Tragic 12.5% |
| Arapaho | 0.0 /100 | #321 | Tragic 12.7% |
| Immigrants | Honduras | 0.0 /100 | #322 | Tragic 12.7% |
| Menominee | 0.0 /100 | #323 | Tragic 12.7% |
| Immigrants | Dominica | 0.0 /100 | #324 | Tragic 12.7% |
| Paiute | 0.0 /100 | #325 | Tragic 13.0% |
| Colville | 0.0 /100 | #326 | Tragic 13.0% |
| Yakama | 0.0 /100 | #327 | Tragic 13.1% |
| Central American Indians | 0.0 /100 | #328 | Tragic 13.3% |
| Blacks/African Americans | 0.0 /100 | #329 | Tragic 13.3% |
| Natives/Alaskans | 0.0 /100 | #330 | Tragic 14.3% |
| Cheyenne | 0.0 /100 | #331 | Tragic 14.3% |
| Dominicans | 0.0 /100 | #332 | Tragic 14.3% |
| Immigrants | Dominican Republic | 0.0 /100 | #333 | Tragic 14.4% |
| Houma | 0.0 /100 | #334 | Tragic 14.6% |
Demographics Similar to Immigrants from Moldova by Family Poverty
In terms of family poverty, the demographic groups most similar to Immigrants from Moldova are Immigrants from North Macedonia (7.7%, a difference of 0.15%), Indian (Asian) (7.7%, a difference of 0.16%), Immigrants from Bolivia (7.7%, a difference of 0.18%), Swiss (7.7%, a difference of 0.22%), and Immigrants from Sweden (7.7%, a difference of 0.23%).
| Demographics | Rating | Rank | Family Poverty |
| Germans | 99.0 /100 | #44 | Exceptional 7.7% |
| Okinawans | 98.9 /100 | #45 | Exceptional 7.7% |
| Tongans | 98.9 /100 | #46 | Exceptional 7.7% |
| Immigrants | Czechoslovakia | 98.9 /100 | #47 | Exceptional 7.7% |
| Immigrants | Sri Lanka | 98.9 /100 | #48 | Exceptional 7.7% |
| Immigrants | Bolivia | 98.9 /100 | #49 | Exceptional 7.7% |
| Immigrants | North Macedonia | 98.9 /100 | #50 | Exceptional 7.7% |
| Immigrants | Moldova | 98.8 /100 | #51 | Exceptional 7.7% |
| Indians (Asian) | 98.8 /100 | #52 | Exceptional 7.7% |
| Swiss | 98.8 /100 | #53 | Exceptional 7.7% |
| Immigrants | Sweden | 98.8 /100 | #54 | Exceptional 7.7% |
| Immigrants | Eastern Asia | 98.7 /100 | #55 | Exceptional 7.7% |
| Immigrants | Serbia | 98.7 /100 | #56 | Exceptional 7.7% |
| Asians | 98.7 /100 | #57 | Exceptional 7.7% |
| Finns | 98.7 /100 | #58 | Exceptional 7.7% |