Bulgarian vs Ottawa Child Poverty Among Boys Under 16
COMPARE
Bulgarian
Ottawa
Child Poverty Among Boys Under 16
Child Poverty Among Boys Under 16 Comparison
Bulgarians
Ottawa
13.3%
CHILD POVERTY AMONG BOYS UNDER 16
99.9/ 100
METRIC RATING
18th/ 347
METRIC RANK
19.5%
CHILD POVERTY AMONG BOYS UNDER 16
0.1/ 100
METRIC RATING
263rd/ 347
METRIC RANK
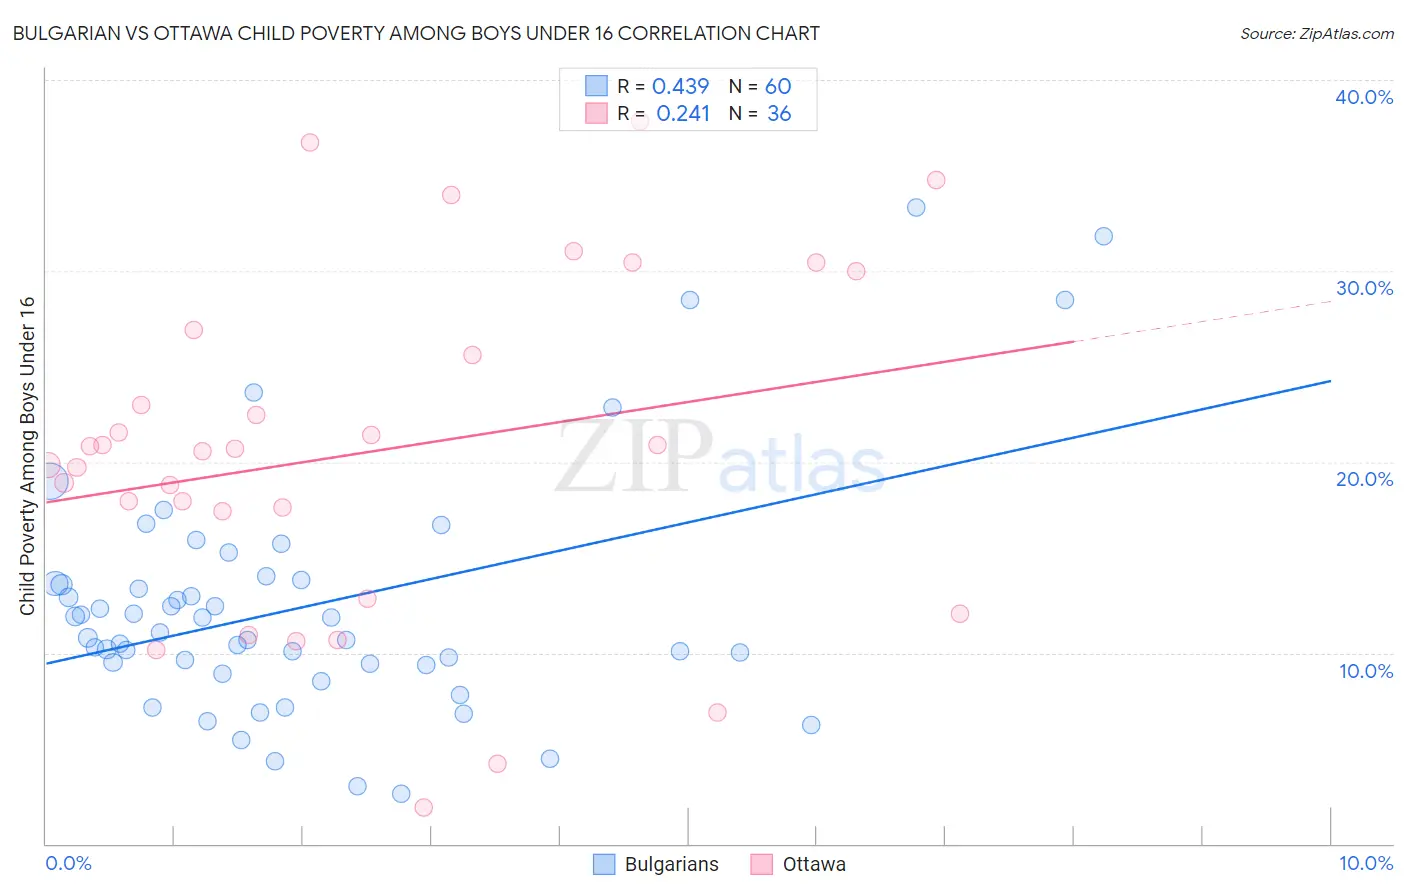
Bulgarian vs Ottawa Child Poverty Among Boys Under 16 Correlation Chart
The statistical analysis conducted on geographies consisting of 203,586,421 people shows a moderate positive correlation between the proportion of Bulgarians and poverty level among boys under the age of 16 in the United States with a correlation coefficient (R) of 0.439 and weighted average of 13.3%. Similarly, the statistical analysis conducted on geographies consisting of 49,695,002 people shows a weak positive correlation between the proportion of Ottawa and poverty level among boys under the age of 16 in the United States with a correlation coefficient (R) of 0.241 and weighted average of 19.5%, a difference of 47.3%.
Child Poverty Among Boys Under 16 Correlation Summary
| Measurement | Bulgarian | Ottawa |
| Minimum | 2.6% | 1.9% |
| Maximum | 33.3% | 37.8% |
| Range | 30.7% | 35.9% |
| Mean | 12.5% | 20.5% |
| Median | 10.9% | 20.6% |
| Interquartile 25% (IQ1) | 9.4% | 15.1% |
| Interquartile 75% (IQ3) | 13.7% | 26.2% |
| Interquartile Range (IQR) | 4.3% | 11.1% |
| Standard Deviation (Sample) | 6.4% | 8.9% |
| Standard Deviation (Population) | 6.3% | 8.8% |
Similar Demographics by Child Poverty Among Boys Under 16
Demographics Similar to Bulgarians by Child Poverty Among Boys Under 16
In terms of child poverty among boys under 16, the demographic groups most similar to Bulgarians are Bolivian (13.3%, a difference of 0.060%), Indian (Asian) (13.3%, a difference of 0.10%), Norwegian (13.2%, a difference of 0.53%), Maltese (13.2%, a difference of 0.62%), and Immigrants from Eastern Asia (13.3%, a difference of 0.70%).
| Demographics | Rating | Rank | Child Poverty Among Boys Under 16 |
| Immigrants | South Central Asia | 100.0 /100 | #11 | Exceptional 12.7% |
| Burmese | 99.9 /100 | #12 | Exceptional 13.0% |
| Immigrants | Korea | 99.9 /100 | #13 | Exceptional 13.0% |
| Immigrants | Ireland | 99.9 /100 | #14 | Exceptional 13.1% |
| Immigrants | Japan | 99.9 /100 | #15 | Exceptional 13.1% |
| Maltese | 99.9 /100 | #16 | Exceptional 13.2% |
| Norwegians | 99.9 /100 | #17 | Exceptional 13.2% |
| Bulgarians | 99.9 /100 | #18 | Exceptional 13.3% |
| Bolivians | 99.9 /100 | #19 | Exceptional 13.3% |
| Indians (Asian) | 99.9 /100 | #20 | Exceptional 13.3% |
| Immigrants | Eastern Asia | 99.9 /100 | #21 | Exceptional 13.3% |
| Tongans | 99.9 /100 | #22 | Exceptional 13.4% |
| Latvians | 99.9 /100 | #23 | Exceptional 13.4% |
| Immigrants | Lithuania | 99.8 /100 | #24 | Exceptional 13.5% |
| Okinawans | 99.8 /100 | #25 | Exceptional 13.5% |
Demographics Similar to Ottawa by Child Poverty Among Boys Under 16
In terms of child poverty among boys under 16, the demographic groups most similar to Ottawa are Iroquois (19.6%, a difference of 0.22%), Immigrants from Guyana (19.5%, a difference of 0.31%), Guyanese (19.6%, a difference of 0.32%), Immigrants from El Salvador (19.6%, a difference of 0.36%), and Vietnamese (19.6%, a difference of 0.37%).
| Demographics | Rating | Rank | Child Poverty Among Boys Under 16 |
| Immigrants | Liberia | 0.2 /100 | #256 | Tragic 19.3% |
| Mexican American Indians | 0.2 /100 | #257 | Tragic 19.4% |
| Potawatomi | 0.2 /100 | #258 | Tragic 19.4% |
| Spanish Americans | 0.2 /100 | #259 | Tragic 19.4% |
| Shoshone | 0.2 /100 | #260 | Tragic 19.4% |
| Immigrants | Ghana | 0.2 /100 | #261 | Tragic 19.4% |
| Immigrants | Guyana | 0.1 /100 | #262 | Tragic 19.5% |
| Ottawa | 0.1 /100 | #263 | Tragic 19.5% |
| Iroquois | 0.1 /100 | #264 | Tragic 19.6% |
| Guyanese | 0.1 /100 | #265 | Tragic 19.6% |
| Immigrants | El Salvador | 0.1 /100 | #266 | Tragic 19.6% |
| Vietnamese | 0.1 /100 | #267 | Tragic 19.6% |
| Spanish American Indians | 0.1 /100 | #268 | Tragic 19.6% |
| Immigrants | Cabo Verde | 0.1 /100 | #269 | Tragic 19.7% |
| Cherokee | 0.1 /100 | #270 | Tragic 19.7% |