Vietnamese vs Immigrants from Ethiopia Nursery School
COMPARE
Vietnamese
Immigrants from Ethiopia
Nursery School
Nursery School Comparison
Vietnamese
Immigrants from Ethiopia
96.8%
NURSERY SCHOOL
0.0/ 100
METRIC RATING
324th/ 347
METRIC RANK
97.6%
NURSERY SCHOOL
0.4/ 100
METRIC RATING
262nd/ 347
METRIC RANK
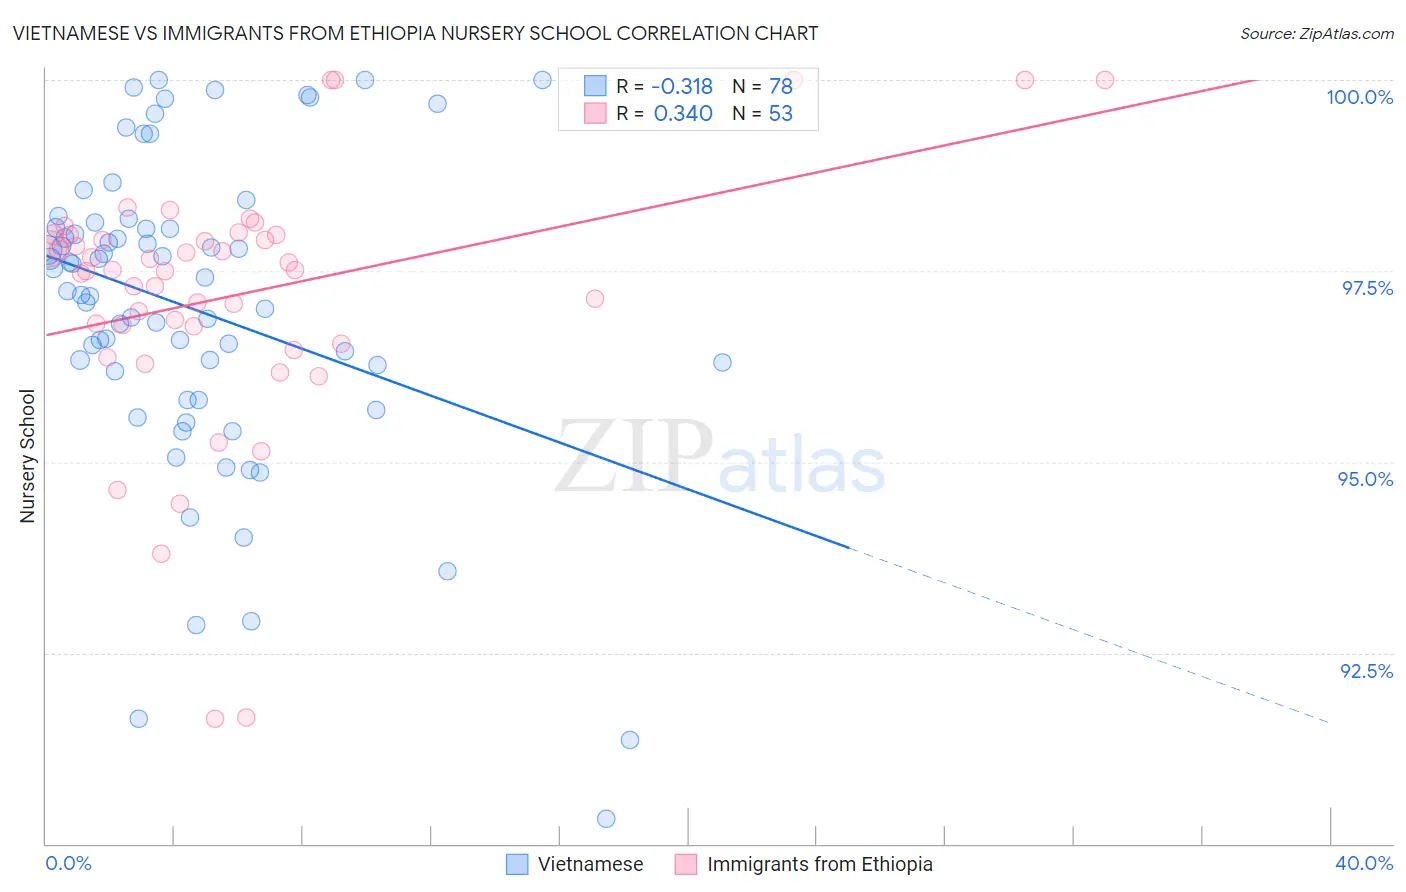
Vietnamese vs Immigrants from Ethiopia Nursery School Correlation Chart
The statistical analysis conducted on geographies consisting of 170,753,564 people shows a mild negative correlation between the proportion of Vietnamese and percentage of population with at least nursery school education in the United States with a correlation coefficient (R) of -0.318 and weighted average of 96.8%. Similarly, the statistical analysis conducted on geographies consisting of 211,539,400 people shows a mild positive correlation between the proportion of Immigrants from Ethiopia and percentage of population with at least nursery school education in the United States with a correlation coefficient (R) of 0.340 and weighted average of 97.6%, a difference of 0.75%.
Nursery School Correlation Summary
| Measurement | Vietnamese | Immigrants from Ethiopia |
| Minimum | 90.3% | 91.6% |
| Maximum | 100.0% | 100.0% |
| Range | 9.7% | 8.4% |
| Mean | 97.0% | 97.2% |
| Median | 97.3% | 97.5% |
| Interquartile 25% (IQ1) | 96.2% | 96.7% |
| Interquartile 75% (IQ3) | 98.1% | 98.0% |
| Interquartile Range (IQR) | 1.9% | 1.3% |
| Standard Deviation (Sample) | 2.0% | 1.7% |
| Standard Deviation (Population) | 2.0% | 1.7% |
Similar Demographics by Nursery School
Demographics Similar to Vietnamese by Nursery School
In terms of nursery school, the demographic groups most similar to Vietnamese are Immigrants from Honduras (96.9%, a difference of 0.010%), Mexican American Indian (96.9%, a difference of 0.020%), Immigrants from Bangladesh (96.9%, a difference of 0.030%), Dominican (96.8%, a difference of 0.030%), and Indonesian (96.8%, a difference of 0.030%).
| Demographics | Rating | Rank | Nursery School |
| Immigrants | Ecuador | 0.0 /100 | #317 | Tragic 96.9% |
| Immigrants | Guyana | 0.0 /100 | #318 | Tragic 96.9% |
| Immigrants | Laos | 0.0 /100 | #319 | Tragic 96.9% |
| Immigrants | Burma/Myanmar | 0.0 /100 | #320 | Tragic 96.9% |
| Immigrants | Bangladesh | 0.0 /100 | #321 | Tragic 96.9% |
| Mexican American Indians | 0.0 /100 | #322 | Tragic 96.9% |
| Immigrants | Honduras | 0.0 /100 | #323 | Tragic 96.9% |
| Vietnamese | 0.0 /100 | #324 | Tragic 96.8% |
| Dominicans | 0.0 /100 | #325 | Tragic 96.8% |
| Indonesians | 0.0 /100 | #326 | Tragic 96.8% |
| Mexicans | 0.0 /100 | #327 | Tragic 96.8% |
| Immigrants | Latin America | 0.0 /100 | #328 | Tragic 96.7% |
| Immigrants | Vietnam | 0.0 /100 | #329 | Tragic 96.7% |
| Japanese | 0.0 /100 | #330 | Tragic 96.7% |
| Immigrants | Armenia | 0.0 /100 | #331 | Tragic 96.7% |
Demographics Similar to Immigrants from Ethiopia by Nursery School
In terms of nursery school, the demographic groups most similar to Immigrants from Ethiopia are Fijian (97.6%, a difference of 0.0%), Armenian (97.6%, a difference of 0.010%), Immigrants from South America (97.6%, a difference of 0.010%), Cuban (97.6%, a difference of 0.010%), and Taiwanese (97.6%, a difference of 0.010%).
| Demographics | Rating | Rank | Nursery School |
| Immigrants | Asia | 0.7 /100 | #255 | Tragic 97.6% |
| Yaqui | 0.6 /100 | #256 | Tragic 97.6% |
| Immigrants | Colombia | 0.6 /100 | #257 | Tragic 97.6% |
| Jamaicans | 0.6 /100 | #258 | Tragic 97.6% |
| Armenians | 0.4 /100 | #259 | Tragic 97.6% |
| Immigrants | South America | 0.4 /100 | #260 | Tragic 97.6% |
| Cubans | 0.4 /100 | #261 | Tragic 97.6% |
| Immigrants | Ethiopia | 0.4 /100 | #262 | Tragic 97.6% |
| Fijians | 0.3 /100 | #263 | Tragic 97.6% |
| Taiwanese | 0.3 /100 | #264 | Tragic 97.6% |
| Assyrians/Chaldeans/Syriacs | 0.3 /100 | #265 | Tragic 97.6% |
| Immigrants | Sierra Leone | 0.3 /100 | #266 | Tragic 97.6% |
| Immigrants | Nigeria | 0.3 /100 | #267 | Tragic 97.5% |
| West Indians | 0.3 /100 | #268 | Tragic 97.5% |
| Immigrants | Liberia | 0.3 /100 | #269 | Tragic 97.5% |