Sioux vs Central American Indian Female Poverty Among 25-34 Year Olds
COMPARE
Sioux
Central American Indian
Female Poverty Among 25-34 Year Olds
Female Poverty Among 25-34 Year Olds Comparison
Sioux
Central American Indians
23.0%
FEMALE POVERTY AMONG 25-34 YEAR OLDS
0.0/ 100
METRIC RATING
340th/ 347
METRIC RANK
18.2%
FEMALE POVERTY AMONG 25-34 YEAR OLDS
0.0/ 100
METRIC RATING
322nd/ 347
METRIC RANK
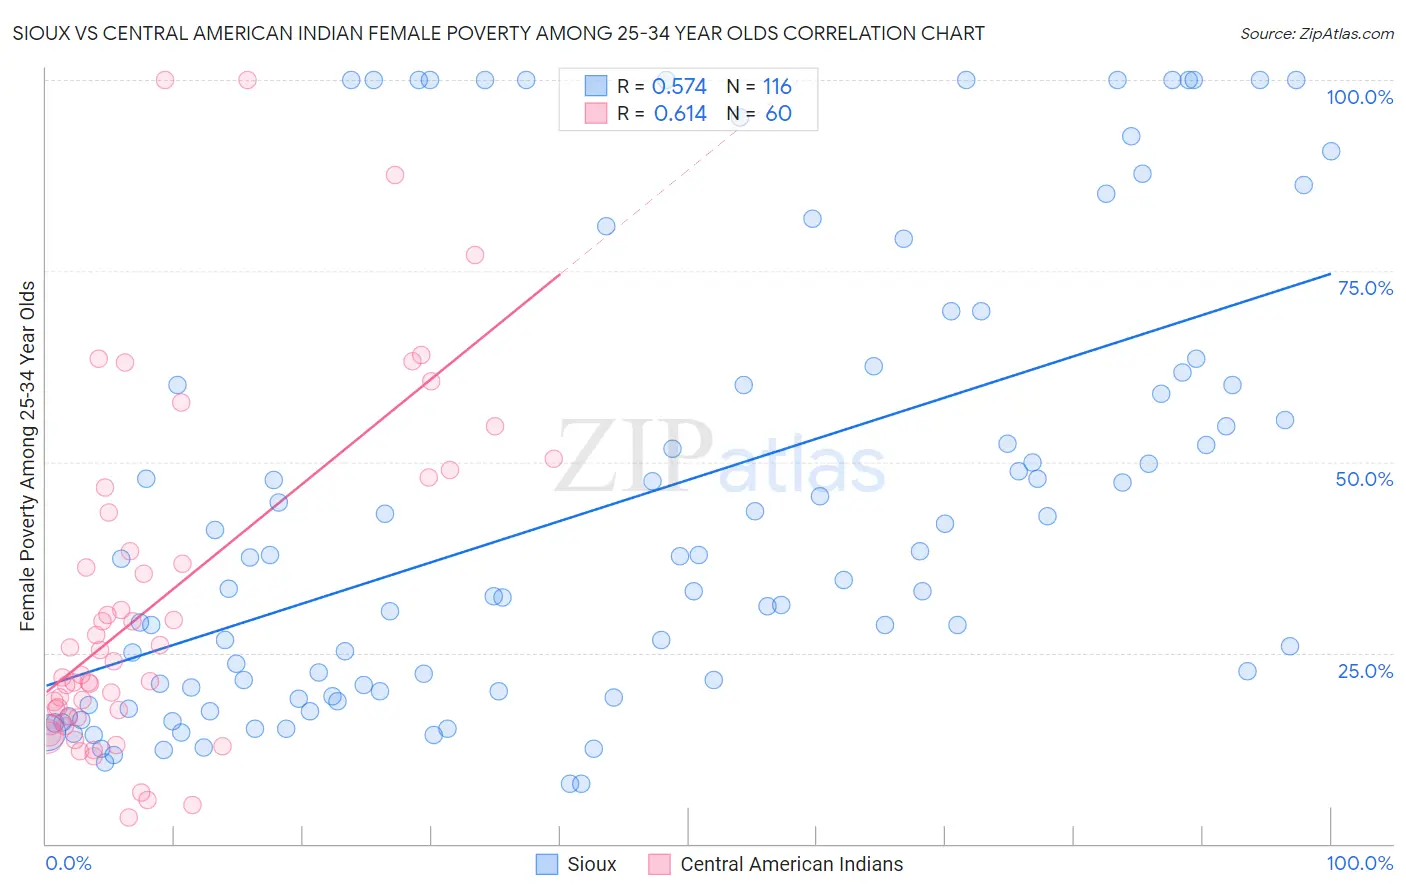
Sioux vs Central American Indian Female Poverty Among 25-34 Year Olds Correlation Chart
The statistical analysis conducted on geographies consisting of 232,165,321 people shows a substantial positive correlation between the proportion of Sioux and poverty level among females between the ages 25 and 34 in the United States with a correlation coefficient (R) of 0.574 and weighted average of 23.0%. Similarly, the statistical analysis conducted on geographies consisting of 323,546,526 people shows a significant positive correlation between the proportion of Central American Indians and poverty level among females between the ages 25 and 34 in the United States with a correlation coefficient (R) of 0.614 and weighted average of 18.2%, a difference of 26.1%.
Female Poverty Among 25-34 Year Olds Correlation Summary
| Measurement | Sioux | Central American Indian |
| Minimum | 7.9% | 3.4% |
| Maximum | 100.0% | 100.0% |
| Range | 92.1% | 96.6% |
| Mean | 44.2% | 32.0% |
| Median | 36.0% | 23.0% |
| Interquartile 25% (IQ1) | 19.6% | 16.6% |
| Interquartile 75% (IQ3) | 60.0% | 45.0% |
| Interquartile Range (IQR) | 40.4% | 28.4% |
| Standard Deviation (Sample) | 29.3% | 22.8% |
| Standard Deviation (Population) | 29.2% | 22.6% |
Demographics Similar to Sioux and Central American Indians by Female Poverty Among 25-34 Year Olds
In terms of female poverty among 25-34 year olds, the demographic groups most similar to Sioux are Yuman (22.9%, a difference of 0.18%), Houma (22.7%, a difference of 1.0%), Crow (22.7%, a difference of 1.2%), Navajo (23.3%, a difference of 1.7%), and Pueblo (22.2%, a difference of 3.5%). Similarly, the demographic groups most similar to Central American Indians are Seminole (18.3%, a difference of 0.32%), Choctaw (18.1%, a difference of 0.84%), Dutch West Indian (18.4%, a difference of 1.3%), Inupiat (18.5%, a difference of 1.8%), and Black/African American (18.9%, a difference of 3.9%).
| Demographics | Rating | Rank | Female Poverty Among 25-34 Year Olds |
| Choctaw | 0.0 /100 | #321 | Tragic 18.1% |
| Central American Indians | 0.0 /100 | #322 | Tragic 18.2% |
| Seminole | 0.0 /100 | #323 | Tragic 18.3% |
| Dutch West Indians | 0.0 /100 | #324 | Tragic 18.4% |
| Inupiat | 0.0 /100 | #325 | Tragic 18.5% |
| Blacks/African Americans | 0.0 /100 | #326 | Tragic 18.9% |
| Cheyenne | 0.0 /100 | #327 | Tragic 19.1% |
| Alaskan Athabascans | 0.0 /100 | #328 | Tragic 19.1% |
| Creek | 0.0 /100 | #329 | Tragic 19.2% |
| Paiute | 0.0 /100 | #330 | Tragic 19.6% |
| Kiowa | 0.0 /100 | #331 | Tragic 19.7% |
| Immigrants | Yemen | 0.0 /100 | #332 | Tragic 19.8% |
| Cajuns | 0.0 /100 | #333 | Tragic 19.9% |
| Apache | 0.0 /100 | #334 | Tragic 20.1% |
| Natives/Alaskans | 0.0 /100 | #335 | Tragic 20.3% |
| Pueblo | 0.0 /100 | #336 | Tragic 22.2% |
| Crow | 0.0 /100 | #337 | Tragic 22.7% |
| Houma | 0.0 /100 | #338 | Tragic 22.7% |
| Yuman | 0.0 /100 | #339 | Tragic 22.9% |
| Sioux | 0.0 /100 | #340 | Tragic 23.0% |
| Navajo | 0.0 /100 | #341 | Tragic 23.3% |