Venezuelan vs Assyrian/Chaldean/Syriac Unemployment Among Women with Children Under 6 years
COMPARE
Venezuelan
Assyrian/Chaldean/Syriac
Unemployment Among Women with Children Under 6 years
Unemployment Among Women with Children Under 6 years Comparison
Venezuelans
Assyrians/Chaldeans/Syriacs
7.2%
UNEMPLOYMENT AMONG WOMEN WITH CHILDREN UNDER 6 YEARS
97.2/ 100
METRIC RATING
105th/ 347
METRIC RANK
6.5%
UNEMPLOYMENT AMONG WOMEN WITH CHILDREN UNDER 6 YEARS
100.0/ 100
METRIC RATING
18th/ 347
METRIC RANK
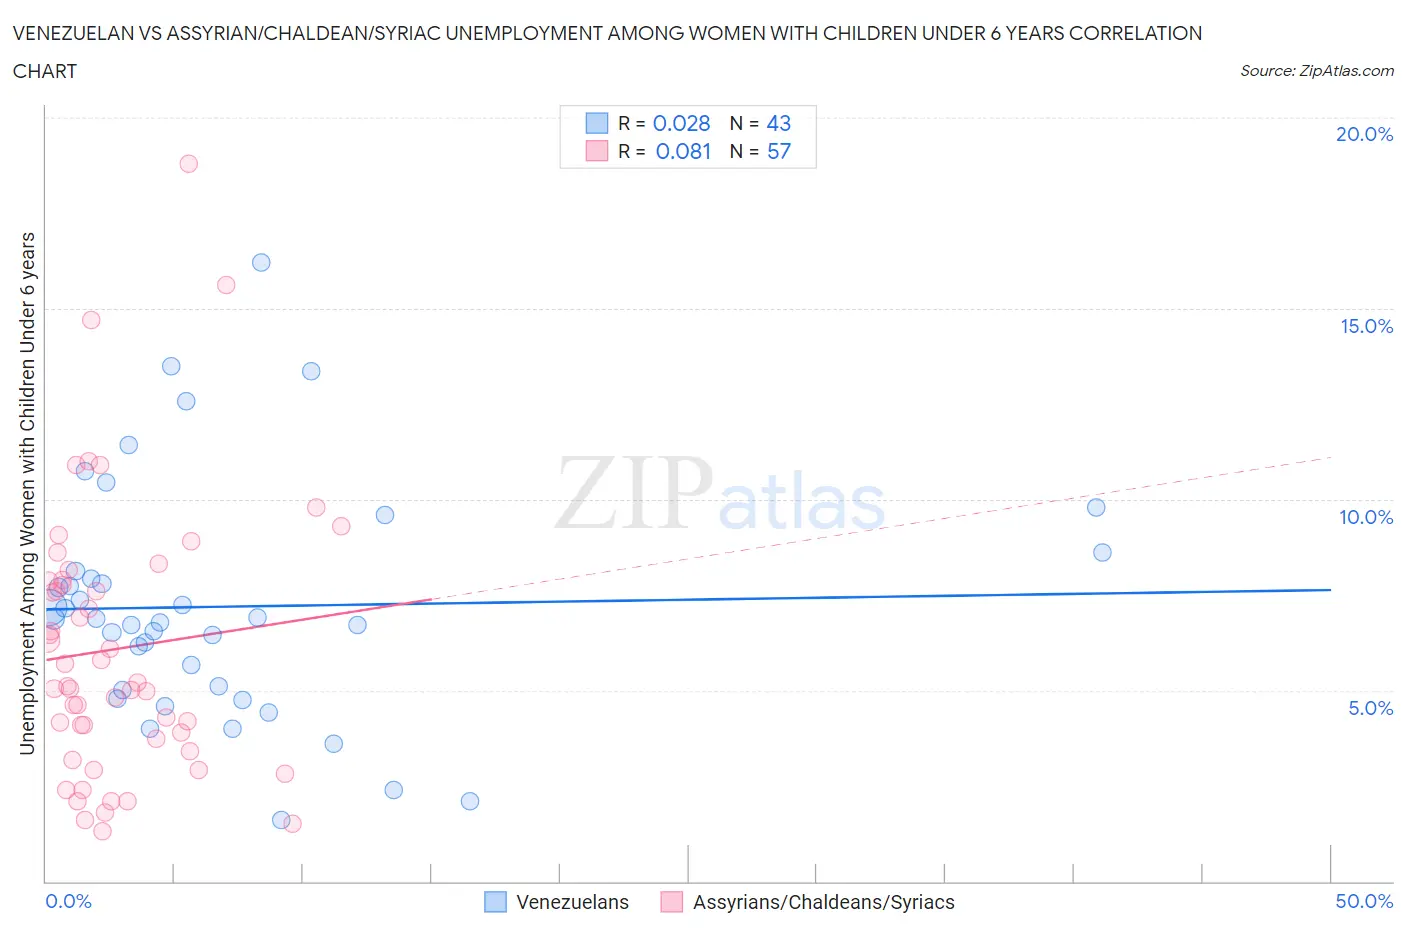
Venezuelan vs Assyrian/Chaldean/Syriac Unemployment Among Women with Children Under 6 years Correlation Chart
The statistical analysis conducted on geographies consisting of 246,662,940 people shows no correlation between the proportion of Venezuelans and unemployment rate among women with children under the age of 6 in the United States with a correlation coefficient (R) of 0.028 and weighted average of 7.2%. Similarly, the statistical analysis conducted on geographies consisting of 98,335,487 people shows a slight positive correlation between the proportion of Assyrians/Chaldeans/Syriacs and unemployment rate among women with children under the age of 6 in the United States with a correlation coefficient (R) of 0.081 and weighted average of 6.5%, a difference of 11.5%.
Unemployment Among Women with Children Under 6 years Correlation Summary
| Measurement | Venezuelan | Assyrian/Chaldean/Syriac |
| Minimum | 1.6% | 1.3% |
| Maximum | 16.2% | 18.8% |
| Range | 14.6% | 17.5% |
| Mean | 7.2% | 6.1% |
| Median | 6.9% | 5.1% |
| Interquartile 25% (IQ1) | 5.0% | 3.6% |
| Interquartile 75% (IQ3) | 8.1% | 7.9% |
| Interquartile Range (IQR) | 3.1% | 4.3% |
| Standard Deviation (Sample) | 3.1% | 3.6% |
| Standard Deviation (Population) | 3.1% | 3.5% |
Similar Demographics by Unemployment Among Women with Children Under 6 years
Demographics Similar to Venezuelans by Unemployment Among Women with Children Under 6 years
In terms of unemployment among women with children under 6 years, the demographic groups most similar to Venezuelans are Immigrants from Egypt (7.2%, a difference of 0.010%), Immigrants from Pakistan (7.2%, a difference of 0.010%), Immigrants from Kazakhstan (7.2%, a difference of 0.030%), Immigrants from Nicaragua (7.2%, a difference of 0.090%), and Immigrants from Saudi Arabia (7.2%, a difference of 0.090%).
| Demographics | Rating | Rank | Unemployment Among Women with Children Under 6 years |
| Russians | 97.5 /100 | #98 | Exceptional 7.2% |
| Immigrants | Europe | 97.5 /100 | #99 | Exceptional 7.2% |
| Immigrants | Northern Europe | 97.4 /100 | #100 | Exceptional 7.2% |
| Chileans | 97.4 /100 | #101 | Exceptional 7.2% |
| Immigrants | Nicaragua | 97.3 /100 | #102 | Exceptional 7.2% |
| Immigrants | Saudi Arabia | 97.3 /100 | #103 | Exceptional 7.2% |
| Immigrants | Egypt | 97.2 /100 | #104 | Exceptional 7.2% |
| Venezuelans | 97.2 /100 | #105 | Exceptional 7.2% |
| Immigrants | Pakistan | 97.2 /100 | #106 | Exceptional 7.2% |
| Immigrants | Kazakhstan | 97.1 /100 | #107 | Exceptional 7.2% |
| Eastern Europeans | 96.9 /100 | #108 | Exceptional 7.2% |
| Australians | 96.9 /100 | #109 | Exceptional 7.2% |
| Palestinians | 96.8 /100 | #110 | Exceptional 7.2% |
| Norwegians | 96.7 /100 | #111 | Exceptional 7.2% |
| Israelis | 96.5 /100 | #112 | Exceptional 7.2% |
Demographics Similar to Assyrians/Chaldeans/Syriacs by Unemployment Among Women with Children Under 6 years
In terms of unemployment among women with children under 6 years, the demographic groups most similar to Assyrians/Chaldeans/Syriacs are Mongolian (6.5%, a difference of 0.32%), Ute (6.5%, a difference of 0.38%), Burmese (6.5%, a difference of 0.43%), Immigrants from Korea (6.5%, a difference of 0.85%), and Immigrants from Malaysia (6.4%, a difference of 0.98%).
| Demographics | Rating | Rank | Unemployment Among Women with Children Under 6 years |
| Indians (Asian) | 100.0 /100 | #11 | Exceptional 6.3% |
| Immigrants | Singapore | 100.0 /100 | #12 | Exceptional 6.3% |
| Immigrants | Eastern Asia | 100.0 /100 | #13 | Exceptional 6.3% |
| Immigrants | Bulgaria | 100.0 /100 | #14 | Exceptional 6.3% |
| Thais | 100.0 /100 | #15 | Exceptional 6.3% |
| Immigrants | Uzbekistan | 100.0 /100 | #16 | Exceptional 6.3% |
| Immigrants | Malaysia | 100.0 /100 | #17 | Exceptional 6.4% |
| Assyrians/Chaldeans/Syriacs | 100.0 /100 | #18 | Exceptional 6.5% |
| Mongolians | 100.0 /100 | #19 | Exceptional 6.5% |
| Ute | 100.0 /100 | #20 | Exceptional 6.5% |
| Burmese | 100.0 /100 | #21 | Exceptional 6.5% |
| Immigrants | Korea | 100.0 /100 | #22 | Exceptional 6.5% |
| Bulgarians | 100.0 /100 | #23 | Exceptional 6.5% |
| Laotians | 100.0 /100 | #24 | Exceptional 6.5% |
| Soviet Union | 100.0 /100 | #25 | Exceptional 6.5% |