Ute vs Luxembourger Child Poverty Under the Age of 16
COMPARE
Ute
Luxembourger
Child Poverty Under the Age of 16
Child Poverty Under the Age of 16 Comparison
Ute
Luxembourgers
21.5%
CHILD POVERTY UNDER THE AGE OF 16
0.0/ 100
METRIC RATING
312th/ 347
METRIC RANK
13.6%
CHILD POVERTY UNDER THE AGE OF 16
99.5/ 100
METRIC RATING
38th/ 347
METRIC RANK
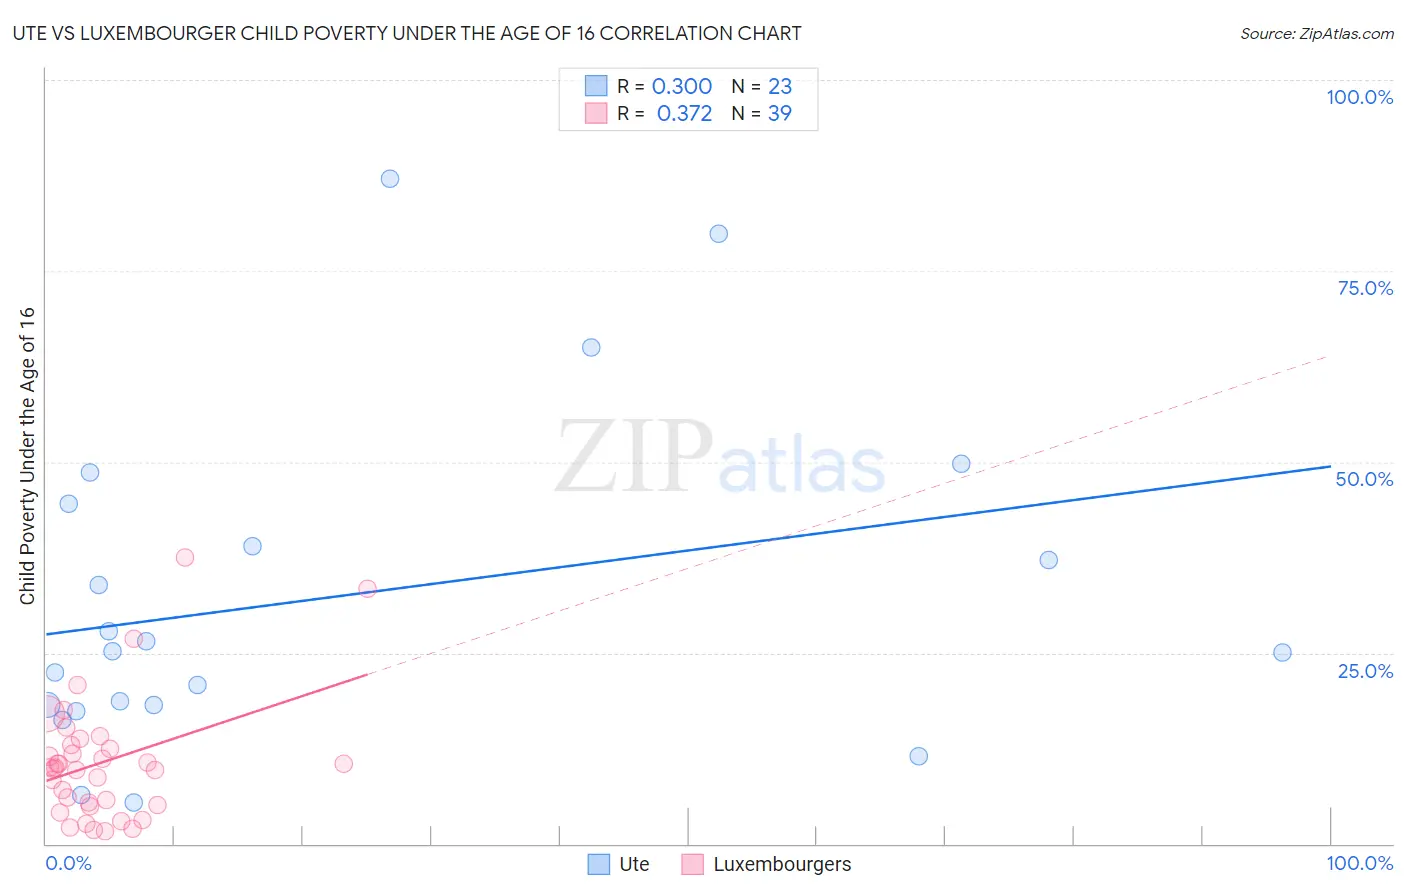
Ute vs Luxembourger Child Poverty Under the Age of 16 Correlation Chart
The statistical analysis conducted on geographies consisting of 55,601,527 people shows a weak positive correlation between the proportion of Ute and poverty level among children under the age of 16 in the United States with a correlation coefficient (R) of 0.300 and weighted average of 21.5%. Similarly, the statistical analysis conducted on geographies consisting of 143,837,676 people shows a mild positive correlation between the proportion of Luxembourgers and poverty level among children under the age of 16 in the United States with a correlation coefficient (R) of 0.372 and weighted average of 13.6%, a difference of 57.9%.
Child Poverty Under the Age of 16 Correlation Summary
| Measurement | Ute | Luxembourger |
| Minimum | 5.4% | 1.6% |
| Maximum | 87.0% | 37.5% |
| Range | 81.7% | 35.9% |
| Mean | 32.4% | 10.7% |
| Median | 25.1% | 10.0% |
| Interquartile 25% (IQ1) | 18.2% | 5.1% |
| Interquartile 75% (IQ3) | 44.6% | 13.0% |
| Interquartile Range (IQR) | 26.4% | 7.9% |
| Standard Deviation (Sample) | 21.7% | 8.0% |
| Standard Deviation (Population) | 21.3% | 7.9% |
Similar Demographics by Child Poverty Under the Age of 16
Demographics Similar to Ute by Child Poverty Under the Age of 16
In terms of child poverty under the age of 16, the demographic groups most similar to Ute are Creek (21.5%, a difference of 0.030%), Immigrants from Somalia (21.6%, a difference of 0.23%), Dutch West Indian (21.5%, a difference of 0.25%), Bahamian (21.5%, a difference of 0.34%), and Immigrants from Mexico (21.5%, a difference of 0.37%).
| Demographics | Rating | Rank | Child Poverty Under the Age of 16 |
| Seminole | 0.0 /100 | #305 | Tragic 21.1% |
| Guatemalans | 0.0 /100 | #306 | Tragic 21.2% |
| Immigrants | Central America | 0.0 /100 | #307 | Tragic 21.3% |
| British West Indians | 0.0 /100 | #308 | Tragic 21.3% |
| Immigrants | Mexico | 0.0 /100 | #309 | Tragic 21.5% |
| Bahamians | 0.0 /100 | #310 | Tragic 21.5% |
| Dutch West Indians | 0.0 /100 | #311 | Tragic 21.5% |
| Ute | 0.0 /100 | #312 | Tragic 21.5% |
| Creek | 0.0 /100 | #313 | Tragic 21.5% |
| Immigrants | Somalia | 0.0 /100 | #314 | Tragic 21.6% |
| Immigrants | Guatemala | 0.0 /100 | #315 | Tragic 21.6% |
| Africans | 0.0 /100 | #316 | Tragic 21.7% |
| Immigrants | Dominica | 0.0 /100 | #317 | Tragic 21.9% |
| U.S. Virgin Islanders | 0.0 /100 | #318 | Tragic 22.0% |
| Yakama | 0.0 /100 | #319 | Tragic 22.1% |
Demographics Similar to Luxembourgers by Child Poverty Under the Age of 16
In terms of child poverty under the age of 16, the demographic groups most similar to Luxembourgers are Immigrants from Australia (13.6%, a difference of 0.020%), Immigrants from Bolivia (13.6%, a difference of 0.51%), Immigrants from Northern Europe (13.6%, a difference of 0.52%), Immigrants from Scotland (13.7%, a difference of 0.71%), and Lithuanian (13.5%, a difference of 0.77%).
| Demographics | Rating | Rank | Child Poverty Under the Age of 16 |
| Danes | 99.7 /100 | #31 | Exceptional 13.4% |
| Tongans | 99.7 /100 | #32 | Exceptional 13.4% |
| Asians | 99.6 /100 | #33 | Exceptional 13.5% |
| Russians | 99.6 /100 | #34 | Exceptional 13.5% |
| Lithuanians | 99.6 /100 | #35 | Exceptional 13.5% |
| Immigrants | Northern Europe | 99.6 /100 | #36 | Exceptional 13.6% |
| Immigrants | Bolivia | 99.6 /100 | #37 | Exceptional 13.6% |
| Luxembourgers | 99.5 /100 | #38 | Exceptional 13.6% |
| Immigrants | Australia | 99.5 /100 | #39 | Exceptional 13.6% |
| Immigrants | Scotland | 99.4 /100 | #40 | Exceptional 13.7% |
| Croatians | 99.4 /100 | #41 | Exceptional 13.8% |
| Immigrants | Sri Lanka | 99.3 /100 | #42 | Exceptional 13.8% |
| Immigrants | Moldova | 99.3 /100 | #43 | Exceptional 13.8% |
| Greeks | 99.3 /100 | #44 | Exceptional 13.8% |
| Czechs | 99.3 /100 | #45 | Exceptional 13.8% |