Ute vs Immigrants from South America Child Poverty Under the Age of 16
COMPARE
Ute
Immigrants from South America
Child Poverty Under the Age of 16
Child Poverty Under the Age of 16 Comparison
Ute
Immigrants from South America
21.5%
CHILD POVERTY UNDER THE AGE OF 16
0.0/ 100
METRIC RATING
312th/ 347
METRIC RANK
16.4%
CHILD POVERTY UNDER THE AGE OF 16
40.8/ 100
METRIC RATING
181st/ 347
METRIC RANK
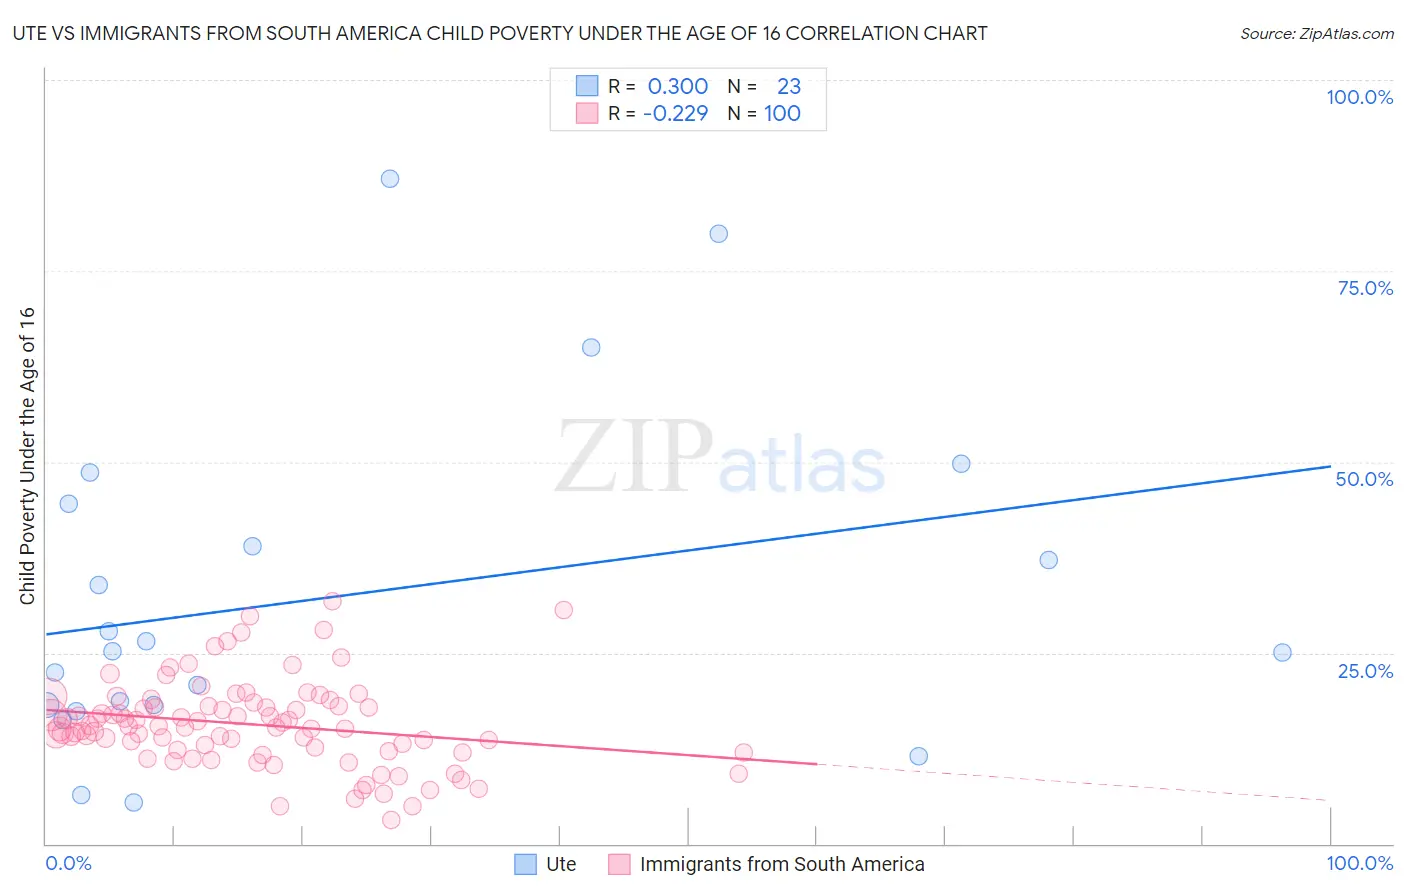
Ute vs Immigrants from South America Child Poverty Under the Age of 16 Correlation Chart
The statistical analysis conducted on geographies consisting of 55,601,527 people shows a weak positive correlation between the proportion of Ute and poverty level among children under the age of 16 in the United States with a correlation coefficient (R) of 0.300 and weighted average of 21.5%. Similarly, the statistical analysis conducted on geographies consisting of 479,730,201 people shows a weak negative correlation between the proportion of Immigrants from South America and poverty level among children under the age of 16 in the United States with a correlation coefficient (R) of -0.229 and weighted average of 16.4%, a difference of 31.4%.
Child Poverty Under the Age of 16 Correlation Summary
| Measurement | Ute | Immigrants from South America |
| Minimum | 5.4% | 3.2% |
| Maximum | 87.0% | 31.7% |
| Range | 81.7% | 28.5% |
| Mean | 32.4% | 15.6% |
| Median | 25.1% | 15.3% |
| Interquartile 25% (IQ1) | 18.2% | 12.2% |
| Interquartile 75% (IQ3) | 44.6% | 18.1% |
| Interquartile Range (IQR) | 26.4% | 5.8% |
| Standard Deviation (Sample) | 21.7% | 5.6% |
| Standard Deviation (Population) | 21.3% | 5.6% |
Similar Demographics by Child Poverty Under the Age of 16
Demographics Similar to Ute by Child Poverty Under the Age of 16
In terms of child poverty under the age of 16, the demographic groups most similar to Ute are Creek (21.5%, a difference of 0.030%), Immigrants from Somalia (21.6%, a difference of 0.23%), Dutch West Indian (21.5%, a difference of 0.25%), Bahamian (21.5%, a difference of 0.34%), and Immigrants from Mexico (21.5%, a difference of 0.37%).
| Demographics | Rating | Rank | Child Poverty Under the Age of 16 |
| Seminole | 0.0 /100 | #305 | Tragic 21.1% |
| Guatemalans | 0.0 /100 | #306 | Tragic 21.2% |
| Immigrants | Central America | 0.0 /100 | #307 | Tragic 21.3% |
| British West Indians | 0.0 /100 | #308 | Tragic 21.3% |
| Immigrants | Mexico | 0.0 /100 | #309 | Tragic 21.5% |
| Bahamians | 0.0 /100 | #310 | Tragic 21.5% |
| Dutch West Indians | 0.0 /100 | #311 | Tragic 21.5% |
| Ute | 0.0 /100 | #312 | Tragic 21.5% |
| Creek | 0.0 /100 | #313 | Tragic 21.5% |
| Immigrants | Somalia | 0.0 /100 | #314 | Tragic 21.6% |
| Immigrants | Guatemala | 0.0 /100 | #315 | Tragic 21.6% |
| Africans | 0.0 /100 | #316 | Tragic 21.7% |
| Immigrants | Dominica | 0.0 /100 | #317 | Tragic 21.9% |
| U.S. Virgin Islanders | 0.0 /100 | #318 | Tragic 22.0% |
| Yakama | 0.0 /100 | #319 | Tragic 22.1% |
Demographics Similar to Immigrants from South America by Child Poverty Under the Age of 16
In terms of child poverty under the age of 16, the demographic groups most similar to Immigrants from South America are South American Indian (16.4%, a difference of 0.12%), Immigrants from Ethiopia (16.4%, a difference of 0.18%), Immigrants from Syria (16.4%, a difference of 0.18%), Ethiopian (16.3%, a difference of 0.31%), and Hawaiian (16.4%, a difference of 0.32%).
| Demographics | Rating | Rank | Child Poverty Under the Age of 16 |
| Whites/Caucasians | 50.0 /100 | #174 | Average 16.2% |
| Scotch-Irish | 47.1 /100 | #175 | Average 16.3% |
| Lebanese | 45.9 /100 | #176 | Average 16.3% |
| Ethiopians | 43.4 /100 | #177 | Average 16.3% |
| Immigrants | Ethiopia | 42.3 /100 | #178 | Average 16.4% |
| Immigrants | Syria | 42.3 /100 | #179 | Average 16.4% |
| South American Indians | 41.8 /100 | #180 | Average 16.4% |
| Immigrants | South America | 40.8 /100 | #181 | Average 16.4% |
| Hawaiians | 38.2 /100 | #182 | Fair 16.4% |
| Celtics | 38.2 /100 | #183 | Fair 16.4% |
| Immigrants | Western Asia | 38.0 /100 | #184 | Fair 16.4% |
| Immigrants | Bosnia and Herzegovina | 37.4 /100 | #185 | Fair 16.5% |
| Kenyans | 34.1 /100 | #186 | Fair 16.5% |
| Arabs | 31.4 /100 | #187 | Fair 16.6% |
| Immigrants | Morocco | 31.2 /100 | #188 | Fair 16.6% |