Venezuelan vs Luxembourger Child Poverty Under the Age of 16
COMPARE
Venezuelan
Luxembourger
Child Poverty Under the Age of 16
Child Poverty Under the Age of 16 Comparison
Venezuelans
Luxembourgers
15.6%
CHILD POVERTY UNDER THE AGE OF 16
77.4/ 100
METRIC RATING
153rd/ 347
METRIC RANK
13.6%
CHILD POVERTY UNDER THE AGE OF 16
99.5/ 100
METRIC RATING
38th/ 347
METRIC RANK
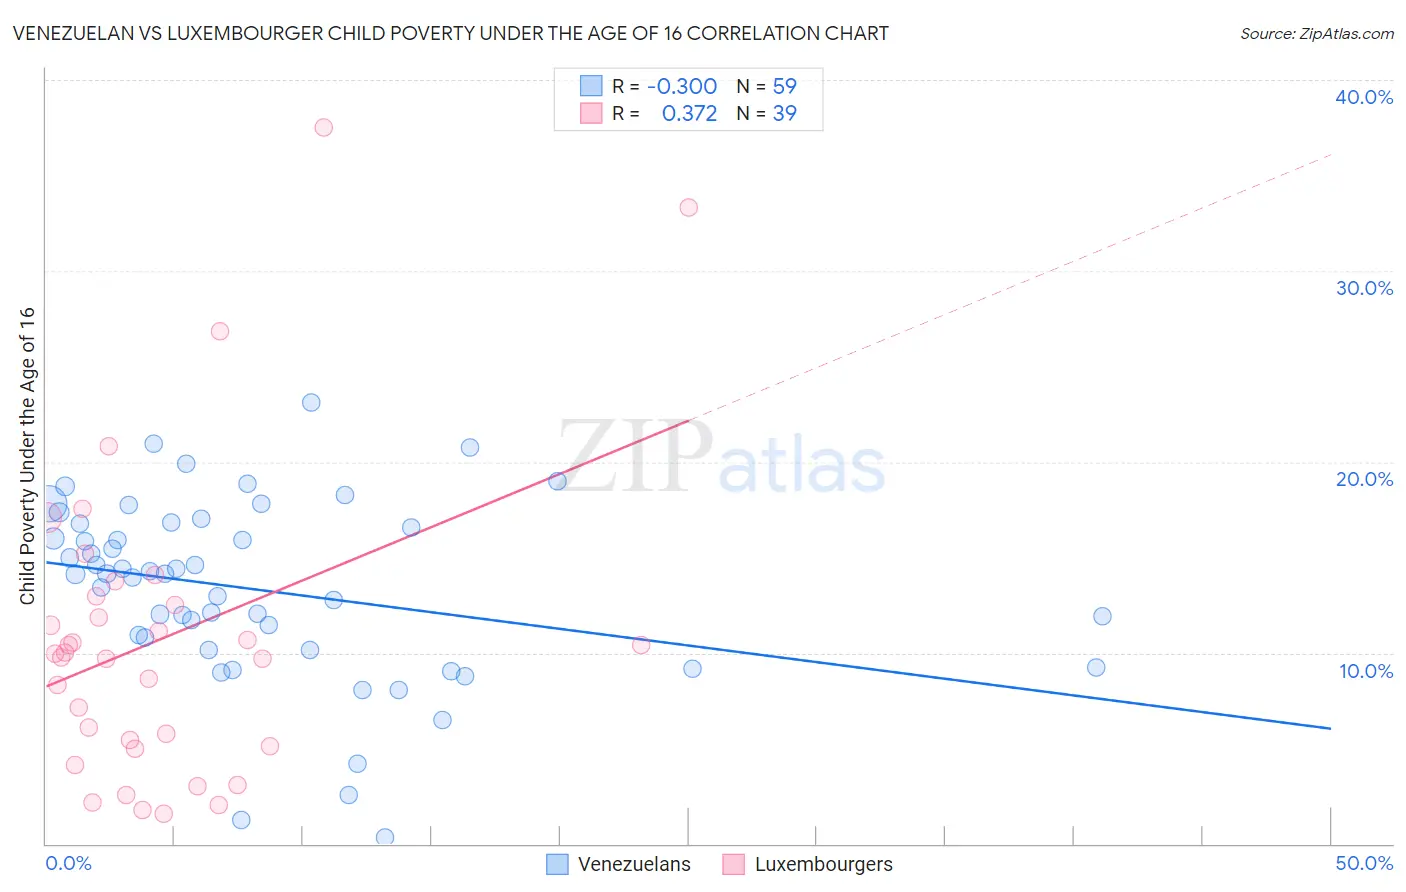
Venezuelan vs Luxembourger Child Poverty Under the Age of 16 Correlation Chart
The statistical analysis conducted on geographies consisting of 304,499,680 people shows a weak negative correlation between the proportion of Venezuelans and poverty level among children under the age of 16 in the United States with a correlation coefficient (R) of -0.300 and weighted average of 15.6%. Similarly, the statistical analysis conducted on geographies consisting of 143,837,676 people shows a mild positive correlation between the proportion of Luxembourgers and poverty level among children under the age of 16 in the United States with a correlation coefficient (R) of 0.372 and weighted average of 13.6%, a difference of 14.4%.
Child Poverty Under the Age of 16 Correlation Summary
| Measurement | Venezuelan | Luxembourger |
| Minimum | 0.32% | 1.6% |
| Maximum | 23.1% | 37.5% |
| Range | 22.8% | 35.9% |
| Mean | 13.3% | 10.7% |
| Median | 14.2% | 10.0% |
| Interquartile 25% (IQ1) | 10.1% | 5.1% |
| Interquartile 75% (IQ3) | 16.8% | 13.0% |
| Interquartile Range (IQR) | 6.7% | 7.9% |
| Standard Deviation (Sample) | 4.8% | 8.0% |
| Standard Deviation (Population) | 4.7% | 7.9% |
Similar Demographics by Child Poverty Under the Age of 16
Demographics Similar to Venezuelans by Child Poverty Under the Age of 16
In terms of child poverty under the age of 16, the demographic groups most similar to Venezuelans are Samoan (15.6%, a difference of 0.030%), French Canadian (15.6%, a difference of 0.15%), French (15.6%, a difference of 0.18%), Immigrants from Jordan (15.6%, a difference of 0.19%), and Syrian (15.6%, a difference of 0.24%).
| Demographics | Rating | Rank | Child Poverty Under the Age of 16 |
| Slovaks | 81.4 /100 | #146 | Excellent 15.5% |
| Immigrants | Kuwait | 80.5 /100 | #147 | Excellent 15.5% |
| Puget Sound Salish | 80.3 /100 | #148 | Excellent 15.5% |
| Israelis | 80.1 /100 | #149 | Excellent 15.5% |
| Immigrants | Jordan | 78.5 /100 | #150 | Good 15.6% |
| French | 78.5 /100 | #151 | Good 15.6% |
| French Canadians | 78.2 /100 | #152 | Good 15.6% |
| Venezuelans | 77.4 /100 | #153 | Good 15.6% |
| Samoans | 77.3 /100 | #154 | Good 15.6% |
| Syrians | 76.1 /100 | #155 | Good 15.6% |
| Immigrants | Venezuela | 74.9 /100 | #156 | Good 15.7% |
| Immigrants | Nepal | 72.9 /100 | #157 | Good 15.7% |
| Immigrants | Chile | 72.8 /100 | #158 | Good 15.7% |
| Immigrants | Fiji | 71.1 /100 | #159 | Good 15.8% |
| Immigrants | Albania | 70.7 /100 | #160 | Good 15.8% |
Demographics Similar to Luxembourgers by Child Poverty Under the Age of 16
In terms of child poverty under the age of 16, the demographic groups most similar to Luxembourgers are Immigrants from Australia (13.6%, a difference of 0.020%), Immigrants from Bolivia (13.6%, a difference of 0.51%), Immigrants from Northern Europe (13.6%, a difference of 0.52%), Immigrants from Scotland (13.7%, a difference of 0.71%), and Lithuanian (13.5%, a difference of 0.77%).
| Demographics | Rating | Rank | Child Poverty Under the Age of 16 |
| Danes | 99.7 /100 | #31 | Exceptional 13.4% |
| Tongans | 99.7 /100 | #32 | Exceptional 13.4% |
| Asians | 99.6 /100 | #33 | Exceptional 13.5% |
| Russians | 99.6 /100 | #34 | Exceptional 13.5% |
| Lithuanians | 99.6 /100 | #35 | Exceptional 13.5% |
| Immigrants | Northern Europe | 99.6 /100 | #36 | Exceptional 13.6% |
| Immigrants | Bolivia | 99.6 /100 | #37 | Exceptional 13.6% |
| Luxembourgers | 99.5 /100 | #38 | Exceptional 13.6% |
| Immigrants | Australia | 99.5 /100 | #39 | Exceptional 13.6% |
| Immigrants | Scotland | 99.4 /100 | #40 | Exceptional 13.7% |
| Croatians | 99.4 /100 | #41 | Exceptional 13.8% |
| Immigrants | Sri Lanka | 99.3 /100 | #42 | Exceptional 13.8% |
| Immigrants | Moldova | 99.3 /100 | #43 | Exceptional 13.8% |
| Greeks | 99.3 /100 | #44 | Exceptional 13.8% |
| Czechs | 99.3 /100 | #45 | Exceptional 13.8% |