Uruguayan vs Tohono O'odham Child Poverty Among Boys Under 16
COMPARE
Uruguayan
Tohono O'odham
Child Poverty Among Boys Under 16
Child Poverty Among Boys Under 16 Comparison
Uruguayans
Tohono O'odham
16.4%
CHILD POVERTY AMONG BOYS UNDER 16
50.0/ 100
METRIC RATING
174th/ 347
METRIC RANK
31.6%
CHILD POVERTY AMONG BOYS UNDER 16
0.0/ 100
METRIC RATING
345th/ 347
METRIC RANK
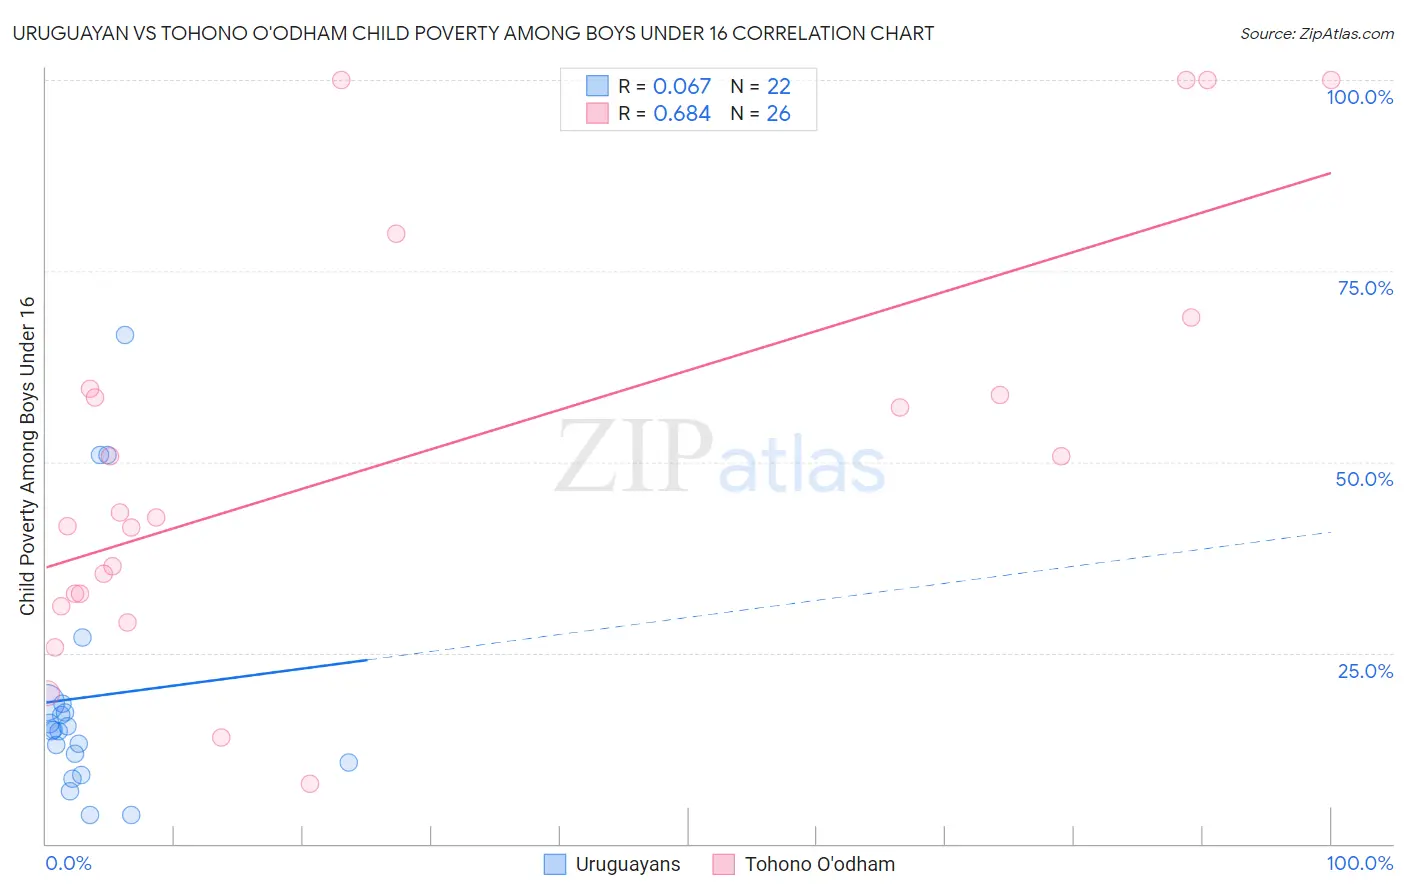
Uruguayan vs Tohono O'odham Child Poverty Among Boys Under 16 Correlation Chart
The statistical analysis conducted on geographies consisting of 143,820,486 people shows a slight positive correlation between the proportion of Uruguayans and poverty level among boys under the age of 16 in the United States with a correlation coefficient (R) of 0.067 and weighted average of 16.4%. Similarly, the statistical analysis conducted on geographies consisting of 58,610,464 people shows a significant positive correlation between the proportion of Tohono O'odham and poverty level among boys under the age of 16 in the United States with a correlation coefficient (R) of 0.684 and weighted average of 31.6%, a difference of 92.1%.
Child Poverty Among Boys Under 16 Correlation Summary
| Measurement | Uruguayan | Tohono O'odham |
| Minimum | 3.7% | 7.9% |
| Maximum | 66.7% | 100.0% |
| Range | 63.0% | 92.1% |
| Mean | 19.2% | 50.7% |
| Median | 14.9% | 43.1% |
| Interquartile 25% (IQ1) | 10.7% | 32.7% |
| Interquartile 75% (IQ3) | 18.3% | 59.6% |
| Interquartile Range (IQR) | 7.6% | 26.9% |
| Standard Deviation (Sample) | 16.2% | 26.9% |
| Standard Deviation (Population) | 15.8% | 26.4% |
Similar Demographics by Child Poverty Among Boys Under 16
Demographics Similar to Uruguayans by Child Poverty Among Boys Under 16
In terms of child poverty among boys under 16, the demographic groups most similar to Uruguayans are Tsimshian (16.4%, a difference of 0.060%), Immigrants from Colombia (16.4%, a difference of 0.090%), Immigrants from Syria (16.5%, a difference of 0.11%), Immigrants from Ethiopia (16.4%, a difference of 0.14%), and Immigrants from Bosnia and Herzegovina (16.4%, a difference of 0.19%).
| Demographics | Rating | Rank | Child Poverty Among Boys Under 16 |
| Afghans | 55.4 /100 | #167 | Average 16.3% |
| South Americans | 55.3 /100 | #168 | Average 16.3% |
| Immigrants | Saudi Arabia | 53.6 /100 | #169 | Average 16.4% |
| Immigrants | Bosnia and Herzegovina | 51.7 /100 | #170 | Average 16.4% |
| Immigrants | Ethiopia | 51.3 /100 | #171 | Average 16.4% |
| Immigrants | Colombia | 50.8 /100 | #172 | Average 16.4% |
| Tsimshian | 50.5 /100 | #173 | Average 16.4% |
| Uruguayans | 50.0 /100 | #174 | Average 16.4% |
| Immigrants | Syria | 49.0 /100 | #175 | Average 16.5% |
| Whites/Caucasians | 48.2 /100 | #176 | Average 16.5% |
| Ethiopians | 47.8 /100 | #177 | Average 16.5% |
| Scotch-Irish | 47.5 /100 | #178 | Average 16.5% |
| Hungarians | 47.3 /100 | #179 | Average 16.5% |
| Hawaiians | 45.5 /100 | #180 | Average 16.5% |
| South American Indians | 44.3 /100 | #181 | Average 16.5% |
Demographics Similar to Tohono O'odham by Child Poverty Among Boys Under 16
In terms of child poverty among boys under 16, the demographic groups most similar to Tohono O'odham are Lumbee (31.9%, a difference of 1.1%), Yuman (30.6%, a difference of 3.0%), Puerto Rican (32.8%, a difference of 4.1%), Navajo (30.3%, a difference of 4.2%), and Pima (29.7%, a difference of 6.1%).
| Demographics | Rating | Rank | Child Poverty Among Boys Under 16 |
| Apache | 0.0 /100 | #333 | Tragic 24.5% |
| Blacks/African Americans | 0.0 /100 | #334 | Tragic 24.5% |
| Yup'ik | 0.0 /100 | #335 | Tragic 24.7% |
| Sioux | 0.0 /100 | #336 | Tragic 25.3% |
| Cheyenne | 0.0 /100 | #337 | Tragic 25.8% |
| Hopi | 0.0 /100 | #338 | Tragic 25.9% |
| Houma | 0.0 /100 | #339 | Tragic 26.2% |
| Crow | 0.0 /100 | #340 | Tragic 26.3% |
| Immigrants | Yemen | 0.0 /100 | #341 | Tragic 28.9% |
| Pima | 0.0 /100 | #342 | Tragic 29.7% |
| Navajo | 0.0 /100 | #343 | Tragic 30.3% |
| Yuman | 0.0 /100 | #344 | Tragic 30.6% |
| Tohono O'odham | 0.0 /100 | #345 | Tragic 31.6% |
| Lumbee | 0.0 /100 | #346 | Tragic 31.9% |
| Puerto Ricans | 0.0 /100 | #347 | Tragic 32.8% |