Uruguayan vs Immigrants from Costa Rica Child Poverty Among Boys Under 16
COMPARE
Uruguayan
Immigrants from Costa Rica
Child Poverty Among Boys Under 16
Child Poverty Among Boys Under 16 Comparison
Uruguayans
Immigrants from Costa Rica
16.4%
CHILD POVERTY AMONG BOYS UNDER 16
50.0/ 100
METRIC RATING
174th/ 347
METRIC RANK
16.7%
CHILD POVERTY AMONG BOYS UNDER 16
37.8/ 100
METRIC RATING
187th/ 347
METRIC RANK
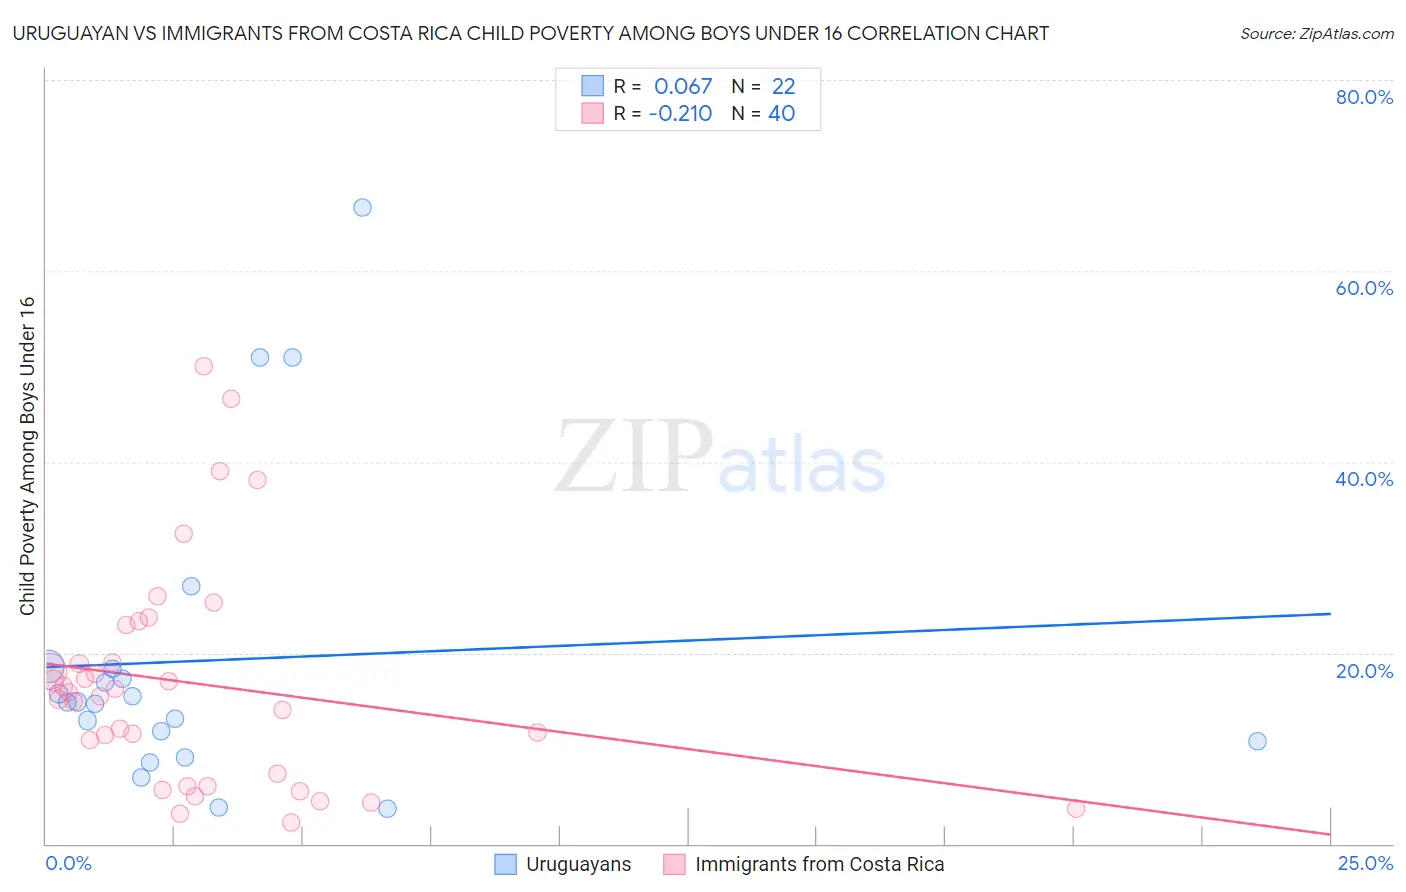
Uruguayan vs Immigrants from Costa Rica Child Poverty Among Boys Under 16 Correlation Chart
The statistical analysis conducted on geographies consisting of 143,820,486 people shows a slight positive correlation between the proportion of Uruguayans and poverty level among boys under the age of 16 in the United States with a correlation coefficient (R) of 0.067 and weighted average of 16.4%. Similarly, the statistical analysis conducted on geographies consisting of 202,823,387 people shows a weak negative correlation between the proportion of Immigrants from Costa Rica and poverty level among boys under the age of 16 in the United States with a correlation coefficient (R) of -0.210 and weighted average of 16.7%, a difference of 1.4%.
Child Poverty Among Boys Under 16 Correlation Summary
| Measurement | Uruguayan | Immigrants from Costa Rica |
| Minimum | 3.7% | 2.3% |
| Maximum | 66.7% | 50.0% |
| Range | 63.0% | 47.7% |
| Mean | 19.2% | 16.8% |
| Median | 14.9% | 15.7% |
| Interquartile 25% (IQ1) | 10.7% | 6.6% |
| Interquartile 75% (IQ3) | 18.3% | 20.9% |
| Interquartile Range (IQR) | 7.6% | 14.3% |
| Standard Deviation (Sample) | 16.2% | 11.6% |
| Standard Deviation (Population) | 15.8% | 11.4% |
Demographics Similar to Uruguayans and Immigrants from Costa Rica by Child Poverty Among Boys Under 16
In terms of child poverty among boys under 16, the demographic groups most similar to Uruguayans are Tsimshian (16.4%, a difference of 0.060%), Immigrants from Colombia (16.4%, a difference of 0.090%), Immigrants from Syria (16.5%, a difference of 0.11%), Immigrants from Ethiopia (16.4%, a difference of 0.14%), and Immigrants from Bosnia and Herzegovina (16.4%, a difference of 0.19%). Similarly, the demographic groups most similar to Immigrants from Costa Rica are Immigrants from South America (16.7%, a difference of 0.010%), Hmong (16.6%, a difference of 0.080%), Immigrants from Western Asia (16.6%, a difference of 0.30%), Celtic (16.6%, a difference of 0.33%), and Kenyan (16.6%, a difference of 0.37%).
| Demographics | Rating | Rank | Child Poverty Among Boys Under 16 |
| Immigrants | Bosnia and Herzegovina | 51.7 /100 | #170 | Average 16.4% |
| Immigrants | Ethiopia | 51.3 /100 | #171 | Average 16.4% |
| Immigrants | Colombia | 50.8 /100 | #172 | Average 16.4% |
| Tsimshian | 50.5 /100 | #173 | Average 16.4% |
| Uruguayans | 50.0 /100 | #174 | Average 16.4% |
| Immigrants | Syria | 49.0 /100 | #175 | Average 16.5% |
| Whites/Caucasians | 48.2 /100 | #176 | Average 16.5% |
| Ethiopians | 47.8 /100 | #177 | Average 16.5% |
| Scotch-Irish | 47.5 /100 | #178 | Average 16.5% |
| Hungarians | 47.3 /100 | #179 | Average 16.5% |
| Hawaiians | 45.5 /100 | #180 | Average 16.5% |
| South American Indians | 44.3 /100 | #181 | Average 16.5% |
| Lebanese | 43.3 /100 | #182 | Average 16.6% |
| Kenyans | 41.0 /100 | #183 | Average 16.6% |
| Celtics | 40.6 /100 | #184 | Average 16.6% |
| Immigrants | Western Asia | 40.4 /100 | #185 | Average 16.6% |
| Hmong | 38.4 /100 | #186 | Fair 16.6% |
| Immigrants | Costa Rica | 37.8 /100 | #187 | Fair 16.7% |
| Immigrants | South America | 37.7 /100 | #188 | Fair 16.7% |
| Immigrants | Morocco | 34.5 /100 | #189 | Fair 16.7% |
| Arabs | 31.1 /100 | #190 | Fair 16.8% |