Polish vs Immigrants from Latin America Child Poverty Among Boys Under 16
COMPARE
Polish
Immigrants from Latin America
Child Poverty Among Boys Under 16
Child Poverty Among Boys Under 16 Comparison
Poles
Immigrants from Latin America
14.4%
CHILD POVERTY AMONG BOYS UNDER 16
98.9/ 100
METRIC RATING
57th/ 347
METRIC RANK
20.6%
CHILD POVERTY AMONG BOYS UNDER 16
0.0/ 100
METRIC RATING
291st/ 347
METRIC RANK
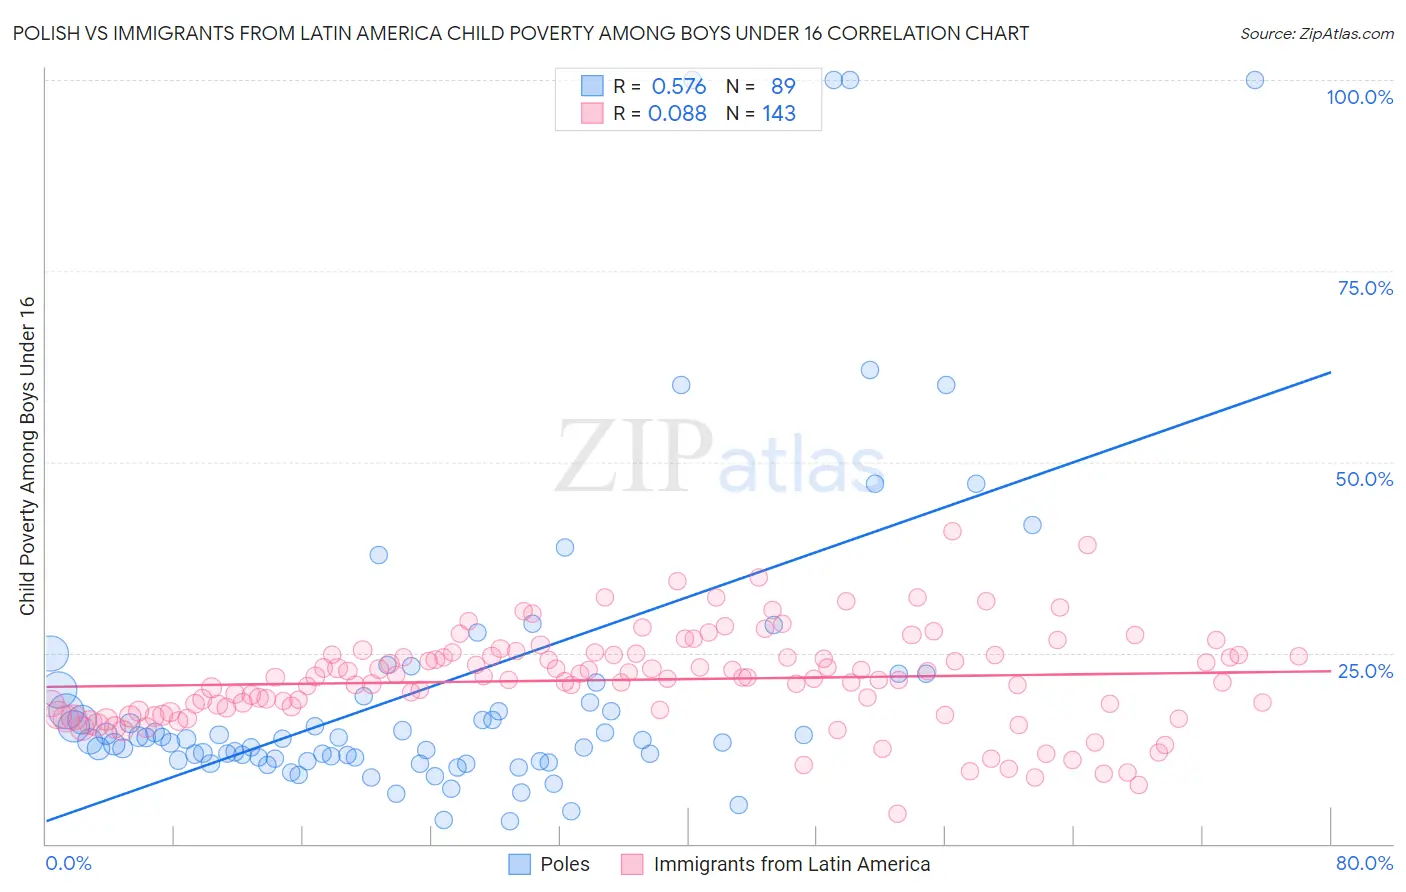
Polish vs Immigrants from Latin America Child Poverty Among Boys Under 16 Correlation Chart
The statistical analysis conducted on geographies consisting of 540,182,984 people shows a substantial positive correlation between the proportion of Poles and poverty level among boys under the age of 16 in the United States with a correlation coefficient (R) of 0.576 and weighted average of 14.4%. Similarly, the statistical analysis conducted on geographies consisting of 541,398,754 people shows a slight positive correlation between the proportion of Immigrants from Latin America and poverty level among boys under the age of 16 in the United States with a correlation coefficient (R) of 0.088 and weighted average of 20.6%, a difference of 43.7%.
Child Poverty Among Boys Under 16 Correlation Summary
| Measurement | Polish | Immigrants from Latin America |
| Minimum | 2.9% | 3.9% |
| Maximum | 100.0% | 40.9% |
| Range | 97.1% | 37.0% |
| Mean | 20.7% | 21.5% |
| Median | 13.7% | 21.7% |
| Interquartile 25% (IQ1) | 11.0% | 17.3% |
| Interquartile 75% (IQ3) | 19.7% | 24.7% |
| Interquartile Range (IQR) | 8.7% | 7.4% |
| Standard Deviation (Sample) | 20.9% | 6.2% |
| Standard Deviation (Population) | 20.8% | 6.2% |
Similar Demographics by Child Poverty Among Boys Under 16
Demographics Similar to Poles by Child Poverty Among Boys Under 16
In terms of child poverty among boys under 16, the demographic groups most similar to Poles are Immigrants from Sweden (14.4%, a difference of 0.080%), Zimbabwean (14.3%, a difference of 0.10%), Immigrants from Czechoslovakia (14.4%, a difference of 0.10%), Immigrants from Pakistan (14.3%, a difference of 0.11%), and Immigrants from Belgium (14.4%, a difference of 0.12%).
| Demographics | Rating | Rank | Child Poverty Among Boys Under 16 |
| Italians | 99.2 /100 | #50 | Exceptional 14.2% |
| Immigrants | Greece | 99.2 /100 | #51 | Exceptional 14.2% |
| Laotians | 99.0 /100 | #52 | Exceptional 14.3% |
| Immigrants | Philippines | 99.0 /100 | #53 | Exceptional 14.3% |
| Immigrants | Serbia | 99.0 /100 | #54 | Exceptional 14.3% |
| Immigrants | Pakistan | 99.0 /100 | #55 | Exceptional 14.3% |
| Zimbabweans | 99.0 /100 | #56 | Exceptional 14.3% |
| Poles | 98.9 /100 | #57 | Exceptional 14.4% |
| Immigrants | Sweden | 98.9 /100 | #58 | Exceptional 14.4% |
| Immigrants | Czechoslovakia | 98.9 /100 | #59 | Exceptional 14.4% |
| Immigrants | Belgium | 98.9 /100 | #60 | Exceptional 14.4% |
| Scandinavians | 98.8 /100 | #61 | Exceptional 14.4% |
| Immigrants | Israel | 98.7 /100 | #62 | Exceptional 14.4% |
| Cambodians | 98.5 /100 | #63 | Exceptional 14.5% |
| Immigrants | Romania | 98.5 /100 | #64 | Exceptional 14.5% |
Demographics Similar to Immigrants from Latin America by Child Poverty Among Boys Under 16
In terms of child poverty among boys under 16, the demographic groups most similar to Immigrants from Latin America are Yaqui (20.7%, a difference of 0.26%), Immigrants from Senegal (20.7%, a difference of 0.27%), Immigrants from Bahamas (20.7%, a difference of 0.39%), Senegalese (20.6%, a difference of 0.44%), and Mexican (20.7%, a difference of 0.52%).
| Demographics | Rating | Rank | Child Poverty Among Boys Under 16 |
| Barbadians | 0.0 /100 | #284 | Tragic 20.2% |
| Arapaho | 0.0 /100 | #285 | Tragic 20.2% |
| West Indians | 0.0 /100 | #286 | Tragic 20.3% |
| Immigrants | Belize | 0.0 /100 | #287 | Tragic 20.3% |
| Immigrants | St. Vincent and the Grenadines | 0.0 /100 | #288 | Tragic 20.3% |
| Blackfeet | 0.0 /100 | #289 | Tragic 20.4% |
| Senegalese | 0.0 /100 | #290 | Tragic 20.6% |
| Immigrants | Latin America | 0.0 /100 | #291 | Tragic 20.6% |
| Yaqui | 0.0 /100 | #292 | Tragic 20.7% |
| Immigrants | Senegal | 0.0 /100 | #293 | Tragic 20.7% |
| Immigrants | Bahamas | 0.0 /100 | #294 | Tragic 20.7% |
| Mexicans | 0.0 /100 | #295 | Tragic 20.7% |
| Indonesians | 0.0 /100 | #296 | Tragic 20.8% |
| Hispanics or Latinos | 0.0 /100 | #297 | Tragic 20.9% |
| Chippewa | 0.0 /100 | #298 | Tragic 21.0% |