Uruguayan vs Eastern European Female Poverty
COMPARE
Uruguayan
Eastern European
Female Poverty
Female Poverty Comparison
Uruguayans
Eastern Europeans
13.6%
FEMALE POVERTY
39.8/ 100
METRIC RATING
189th/ 347
METRIC RANK
11.5%
FEMALE POVERTY
99.7/ 100
METRIC RATING
20th/ 347
METRIC RANK
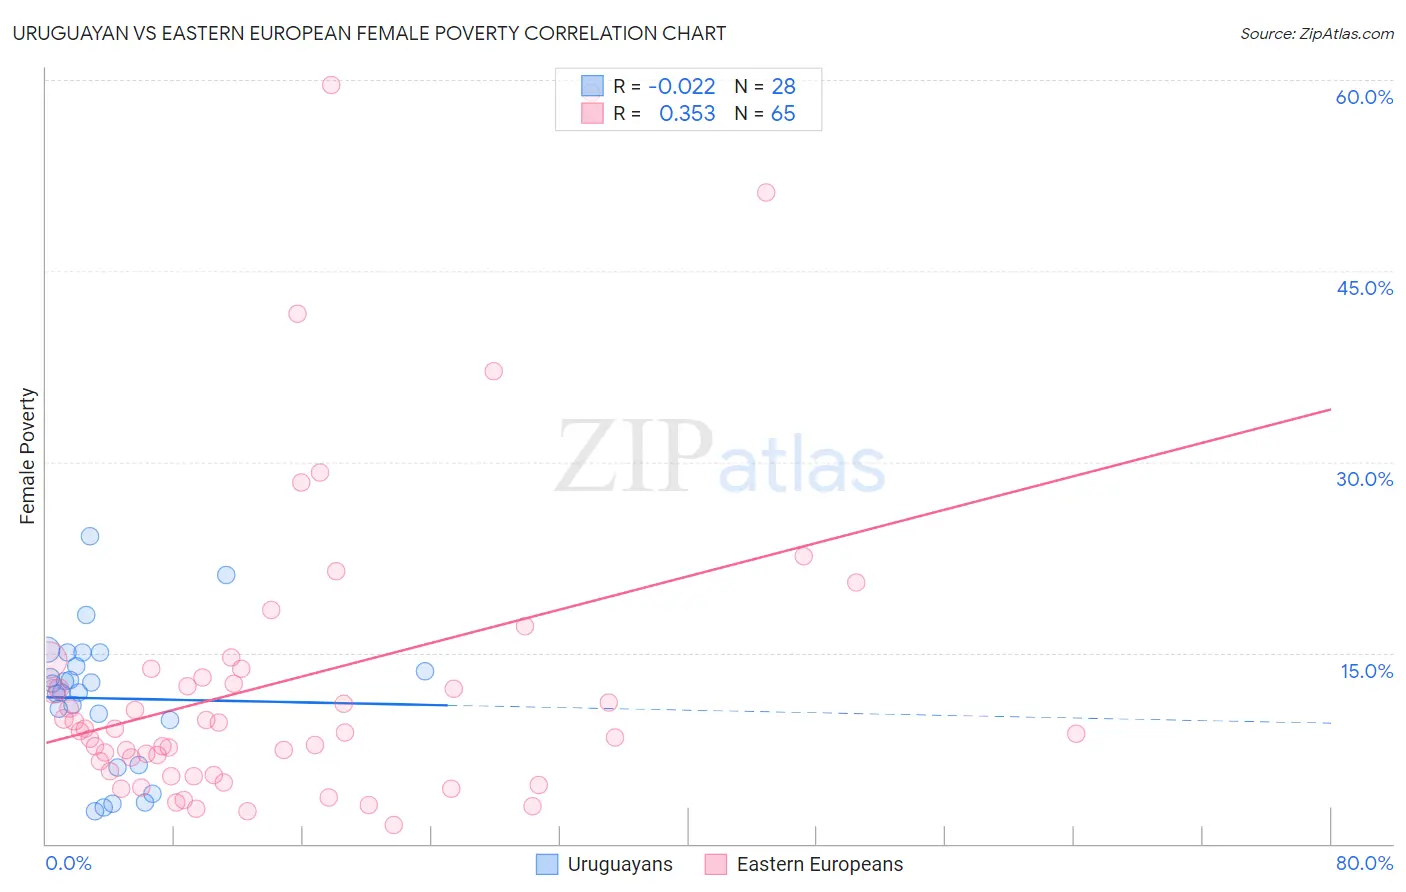
Uruguayan vs Eastern European Female Poverty Correlation Chart
The statistical analysis conducted on geographies consisting of 144,759,999 people shows no correlation between the proportion of Uruguayans and poverty level among females in the United States with a correlation coefficient (R) of -0.022 and weighted average of 13.6%. Similarly, the statistical analysis conducted on geographies consisting of 460,773,883 people shows a mild positive correlation between the proportion of Eastern Europeans and poverty level among females in the United States with a correlation coefficient (R) of 0.353 and weighted average of 11.5%, a difference of 17.7%.
Female Poverty Correlation Summary
| Measurement | Uruguayan | Eastern European |
| Minimum | 2.5% | 1.4% |
| Maximum | 24.1% | 59.6% |
| Range | 21.6% | 58.2% |
| Mean | 11.4% | 12.7% |
| Median | 12.3% | 8.8% |
| Interquartile 25% (IQ1) | 8.0% | 5.5% |
| Interquartile 75% (IQ3) | 14.4% | 13.4% |
| Interquartile Range (IQR) | 6.5% | 7.9% |
| Standard Deviation (Sample) | 5.4% | 12.4% |
| Standard Deviation (Population) | 5.3% | 12.3% |
Similar Demographics by Female Poverty
Demographics Similar to Uruguayans by Female Poverty
In terms of female poverty, the demographic groups most similar to Uruguayans are Hawaiian (13.6%, a difference of 0.010%), Immigrants from Venezuela (13.6%, a difference of 0.11%), Immigrants from Portugal (13.6%, a difference of 0.17%), Immigrants from Cameroon (13.5%, a difference of 0.22%), and Immigrants from Sierra Leone (13.5%, a difference of 0.33%).
| Demographics | Rating | Rank | Female Poverty |
| Immigrants | Colombia | 44.5 /100 | #182 | Average 13.5% |
| Kenyans | 43.8 /100 | #183 | Average 13.5% |
| Immigrants | Sierra Leone | 43.2 /100 | #184 | Average 13.5% |
| Immigrants | Cameroon | 42.0 /100 | #185 | Average 13.5% |
| Immigrants | Portugal | 41.5 /100 | #186 | Average 13.6% |
| Immigrants | Venezuela | 41.0 /100 | #187 | Average 13.6% |
| Hawaiians | 39.9 /100 | #188 | Fair 13.6% |
| Uruguayans | 39.8 /100 | #189 | Fair 13.6% |
| Sierra Leoneans | 33.1 /100 | #190 | Fair 13.7% |
| Immigrants | Kuwait | 32.7 /100 | #191 | Fair 13.7% |
| Immigrants | Costa Rica | 31.9 /100 | #192 | Fair 13.7% |
| Iraqis | 31.8 /100 | #193 | Fair 13.7% |
| Delaware | 31.1 /100 | #194 | Fair 13.7% |
| Immigrants | South America | 30.6 /100 | #195 | Fair 13.7% |
| South American Indians | 28.9 /100 | #196 | Fair 13.7% |
Demographics Similar to Eastern Europeans by Female Poverty
In terms of female poverty, the demographic groups most similar to Eastern Europeans are Norwegian (11.5%, a difference of 0.23%), Immigrants from Scotland (11.5%, a difference of 0.27%), Bolivian (11.5%, a difference of 0.32%), Immigrants from Bolivia (11.5%, a difference of 0.39%), and Italian (11.6%, a difference of 0.50%).
| Demographics | Rating | Rank | Female Poverty |
| Immigrants | Lithuania | 99.9 /100 | #13 | Exceptional 11.3% |
| Lithuanians | 99.8 /100 | #14 | Exceptional 11.4% |
| Latvians | 99.8 /100 | #15 | Exceptional 11.4% |
| Immigrants | Bolivia | 99.8 /100 | #16 | Exceptional 11.5% |
| Bolivians | 99.8 /100 | #17 | Exceptional 11.5% |
| Immigrants | Scotland | 99.8 /100 | #18 | Exceptional 11.5% |
| Norwegians | 99.8 /100 | #19 | Exceptional 11.5% |
| Eastern Europeans | 99.7 /100 | #20 | Exceptional 11.5% |
| Italians | 99.7 /100 | #21 | Exceptional 11.6% |
| Swedes | 99.7 /100 | #22 | Exceptional 11.6% |
| Burmese | 99.7 /100 | #23 | Exceptional 11.6% |
| Luxembourgers | 99.7 /100 | #24 | Exceptional 11.6% |
| Immigrants | Northern Europe | 99.6 /100 | #25 | Exceptional 11.6% |
| Croatians | 99.6 /100 | #26 | Exceptional 11.6% |
| Iranians | 99.6 /100 | #27 | Exceptional 11.7% |