Czech vs Dominican Family Poverty
COMPARE
Czech
Dominican
Family Poverty
Family Poverty Comparison
Czechs
Dominicans
7.4%
FAMILY POVERTY
99.6/ 100
METRIC RATING
31st/ 347
METRIC RANK
14.3%
FAMILY POVERTY
0.0/ 100
METRIC RATING
332nd/ 347
METRIC RANK
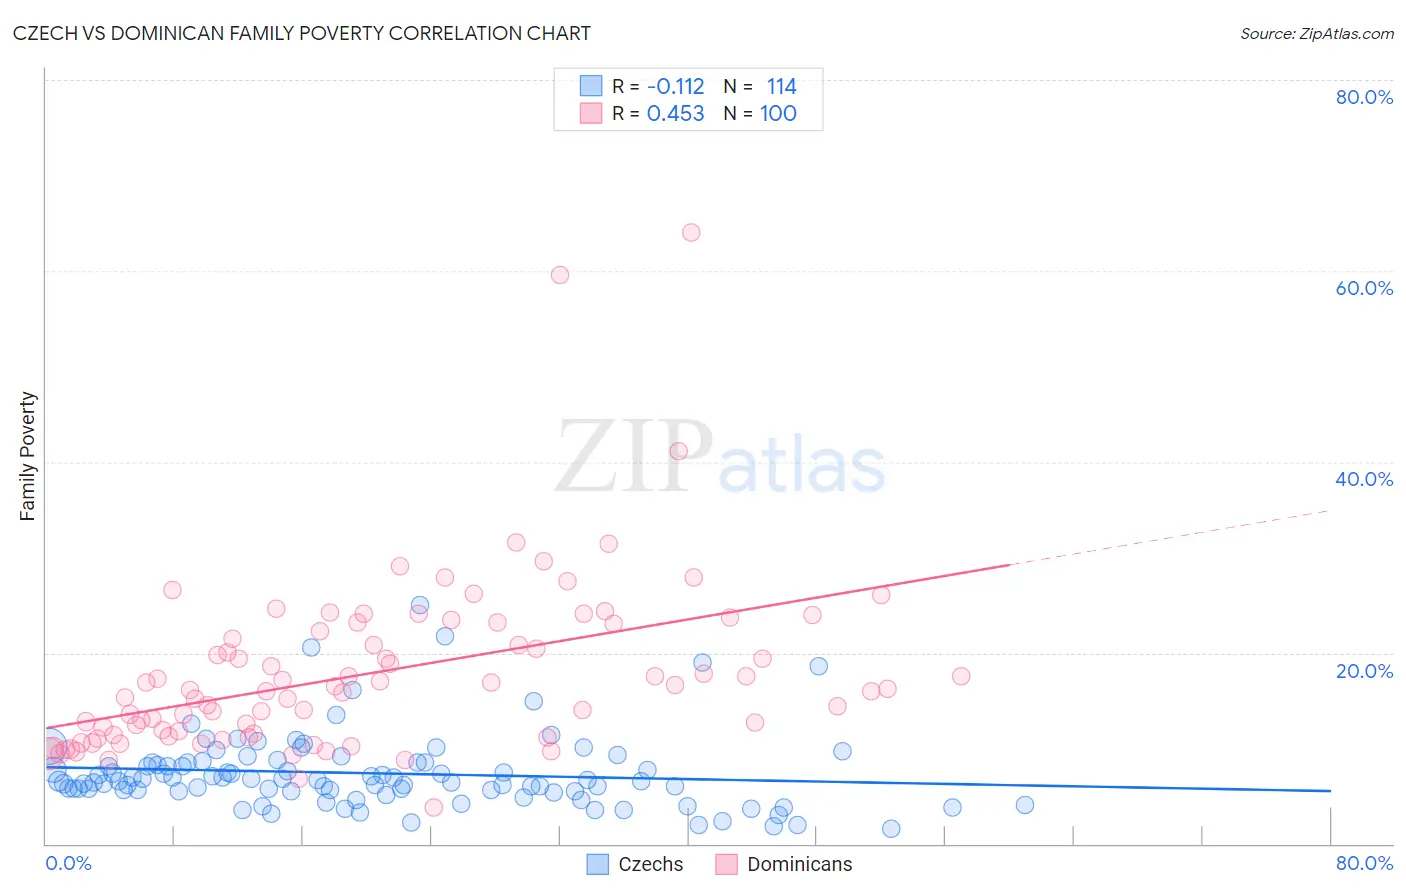
Czech vs Dominican Family Poverty Correlation Chart
The statistical analysis conducted on geographies consisting of 482,390,324 people shows a poor negative correlation between the proportion of Czechs and poverty level among families in the United States with a correlation coefficient (R) of -0.112 and weighted average of 7.4%. Similarly, the statistical analysis conducted on geographies consisting of 353,965,759 people shows a moderate positive correlation between the proportion of Dominicans and poverty level among families in the United States with a correlation coefficient (R) of 0.453 and weighted average of 14.3%, a difference of 93.5%.
Family Poverty Correlation Summary
| Measurement | Czech | Dominican |
| Minimum | 1.6% | 3.8% |
| Maximum | 25.0% | 64.0% |
| Range | 23.4% | 60.2% |
| Mean | 7.4% | 17.9% |
| Median | 6.6% | 16.1% |
| Interquartile 25% (IQ1) | 5.5% | 11.4% |
| Interquartile 75% (IQ3) | 8.5% | 22.6% |
| Interquartile Range (IQR) | 3.0% | 11.2% |
| Standard Deviation (Sample) | 4.0% | 9.1% |
| Standard Deviation (Population) | 3.9% | 9.1% |
Similar Demographics by Family Poverty
Demographics Similar to Czechs by Family Poverty
In terms of family poverty, the demographic groups most similar to Czechs are Italian (7.4%, a difference of 0.12%), Polish (7.4%, a difference of 0.30%), Immigrants from Japan (7.4%, a difference of 0.30%), Immigrants from Northern Europe (7.4%, a difference of 0.41%), and Russian (7.5%, a difference of 0.53%).
| Demographics | Rating | Rank | Family Poverty |
| Croatians | 99.7 /100 | #24 | Exceptional 7.3% |
| Burmese | 99.7 /100 | #25 | Exceptional 7.3% |
| Cypriots | 99.6 /100 | #26 | Exceptional 7.3% |
| Immigrants | Scotland | 99.6 /100 | #27 | Exceptional 7.3% |
| Immigrants | Korea | 99.6 /100 | #28 | Exceptional 7.4% |
| Immigrants | Northern Europe | 99.6 /100 | #29 | Exceptional 7.4% |
| Italians | 99.6 /100 | #30 | Exceptional 7.4% |
| Czechs | 99.6 /100 | #31 | Exceptional 7.4% |
| Poles | 99.5 /100 | #32 | Exceptional 7.4% |
| Immigrants | Japan | 99.5 /100 | #33 | Exceptional 7.4% |
| Russians | 99.5 /100 | #34 | Exceptional 7.5% |
| Greeks | 99.4 /100 | #35 | Exceptional 7.5% |
| Turks | 99.4 /100 | #36 | Exceptional 7.5% |
| Estonians | 99.4 /100 | #37 | Exceptional 7.5% |
| Bolivians | 99.3 /100 | #38 | Exceptional 7.5% |
Demographics Similar to Dominicans by Family Poverty
In terms of family poverty, the demographic groups most similar to Dominicans are Cheyenne (14.3%, a difference of 0.44%), Native/Alaskan (14.3%, a difference of 0.58%), Immigrants from Dominican Republic (14.4%, a difference of 0.63%), Houma (14.6%, a difference of 1.9%), and Apache (14.7%, a difference of 2.8%).
| Demographics | Rating | Rank | Family Poverty |
| Paiute | 0.0 /100 | #325 | Tragic 13.0% |
| Colville | 0.0 /100 | #326 | Tragic 13.0% |
| Yakama | 0.0 /100 | #327 | Tragic 13.1% |
| Central American Indians | 0.0 /100 | #328 | Tragic 13.3% |
| Blacks/African Americans | 0.0 /100 | #329 | Tragic 13.3% |
| Natives/Alaskans | 0.0 /100 | #330 | Tragic 14.3% |
| Cheyenne | 0.0 /100 | #331 | Tragic 14.3% |
| Dominicans | 0.0 /100 | #332 | Tragic 14.3% |
| Immigrants | Dominican Republic | 0.0 /100 | #333 | Tragic 14.4% |
| Houma | 0.0 /100 | #334 | Tragic 14.6% |
| Apache | 0.0 /100 | #335 | Tragic 14.7% |
| Sioux | 0.0 /100 | #336 | Tragic 15.9% |
| Hopi | 0.0 /100 | #337 | Tragic 15.9% |
| Crow | 0.0 /100 | #338 | Tragic 16.1% |
| Yuman | 0.0 /100 | #339 | Tragic 16.6% |