Immigrants from Brazil vs Dominican Family Poverty
COMPARE
Immigrants from Brazil
Dominican
Family Poverty
Family Poverty Comparison
Immigrants from Brazil
Dominicans
8.5%
FAMILY POVERTY
86.3/ 100
METRIC RATING
136th/ 347
METRIC RANK
14.3%
FAMILY POVERTY
0.0/ 100
METRIC RATING
332nd/ 347
METRIC RANK
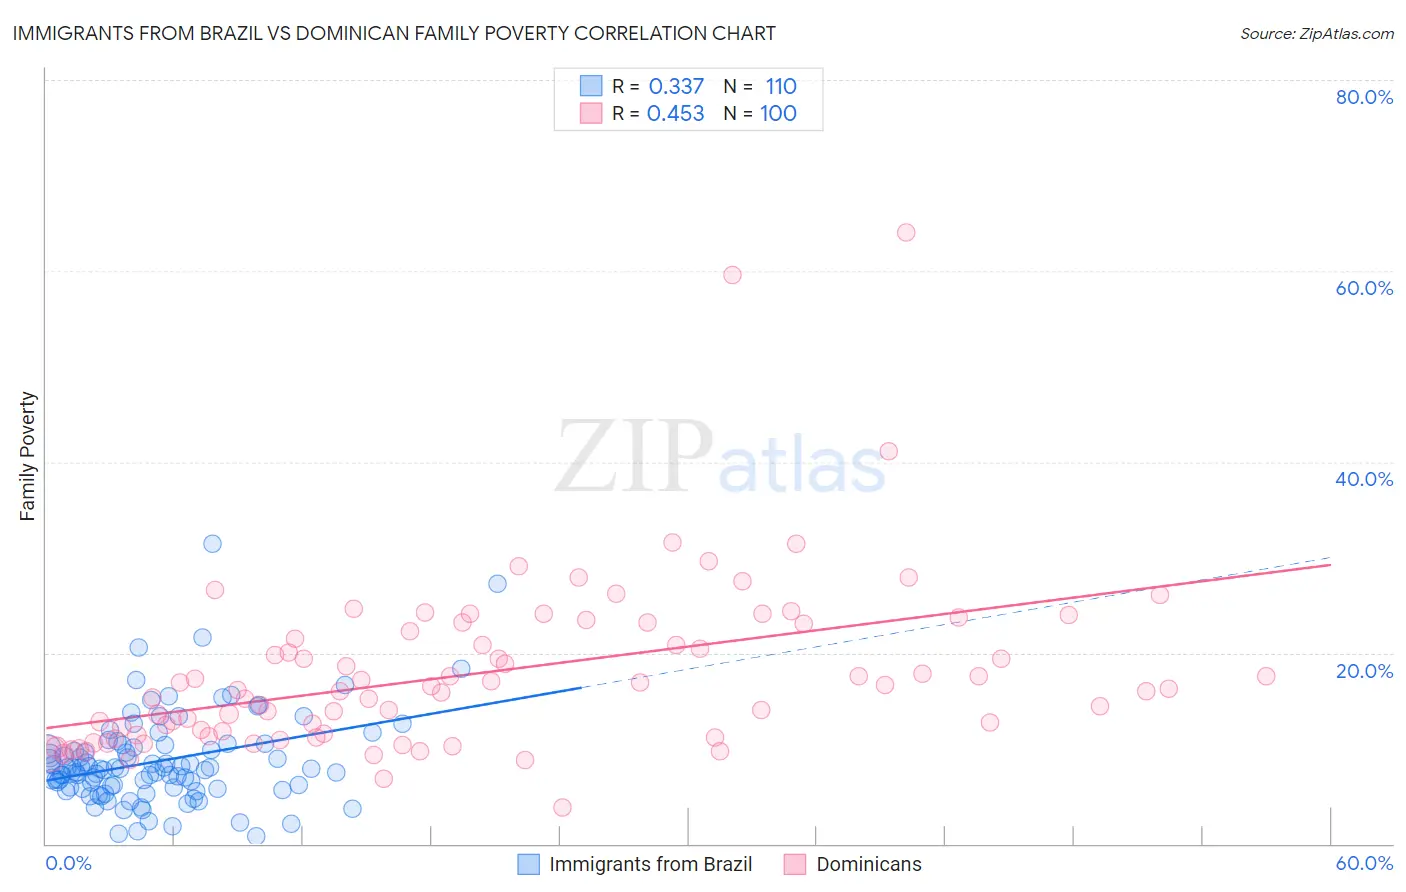
Immigrants from Brazil vs Dominican Family Poverty Correlation Chart
The statistical analysis conducted on geographies consisting of 342,227,050 people shows a mild positive correlation between the proportion of Immigrants from Brazil and poverty level among families in the United States with a correlation coefficient (R) of 0.337 and weighted average of 8.5%. Similarly, the statistical analysis conducted on geographies consisting of 353,965,759 people shows a moderate positive correlation between the proportion of Dominicans and poverty level among families in the United States with a correlation coefficient (R) of 0.453 and weighted average of 14.3%, a difference of 69.5%.
Family Poverty Correlation Summary
| Measurement | Immigrants from Brazil | Dominican |
| Minimum | 0.81% | 3.8% |
| Maximum | 31.4% | 64.0% |
| Range | 30.6% | 60.2% |
| Mean | 8.7% | 17.9% |
| Median | 7.8% | 16.1% |
| Interquartile 25% (IQ1) | 5.9% | 11.4% |
| Interquartile 75% (IQ3) | 10.3% | 22.6% |
| Interquartile Range (IQR) | 4.4% | 11.2% |
| Standard Deviation (Sample) | 4.9% | 9.1% |
| Standard Deviation (Population) | 4.9% | 9.1% |
Similar Demographics by Family Poverty
Demographics Similar to Immigrants from Brazil by Family Poverty
In terms of family poverty, the demographic groups most similar to Immigrants from Brazil are Immigrants from Malaysia (8.5%, a difference of 0.040%), Chilean (8.5%, a difference of 0.080%), Immigrants from Southern Europe (8.5%, a difference of 0.080%), Sri Lankan (8.5%, a difference of 0.090%), and Armenian (8.5%, a difference of 0.48%).
| Demographics | Rating | Rank | Family Poverty |
| Portuguese | 89.2 /100 | #129 | Excellent 8.4% |
| Immigrants | Bosnia and Herzegovina | 88.6 /100 | #130 | Excellent 8.4% |
| Puget Sound Salish | 88.6 /100 | #131 | Excellent 8.4% |
| Immigrants | Argentina | 88.2 /100 | #132 | Excellent 8.4% |
| Sri Lankans | 86.6 /100 | #133 | Excellent 8.5% |
| Chileans | 86.6 /100 | #134 | Excellent 8.5% |
| Immigrants | Malaysia | 86.5 /100 | #135 | Excellent 8.5% |
| Immigrants | Brazil | 86.3 /100 | #136 | Excellent 8.5% |
| Immigrants | Southern Europe | 86.0 /100 | #137 | Excellent 8.5% |
| Armenians | 84.6 /100 | #138 | Excellent 8.5% |
| Immigrants | Nepal | 84.2 /100 | #139 | Excellent 8.5% |
| Immigrants | Kazakhstan | 84.1 /100 | #140 | Excellent 8.5% |
| Immigrants | Ukraine | 83.9 /100 | #141 | Excellent 8.5% |
| Yugoslavians | 83.5 /100 | #142 | Excellent 8.5% |
| Immigrants | Germany | 83.3 /100 | #143 | Excellent 8.5% |
Demographics Similar to Dominicans by Family Poverty
In terms of family poverty, the demographic groups most similar to Dominicans are Cheyenne (14.3%, a difference of 0.44%), Native/Alaskan (14.3%, a difference of 0.58%), Immigrants from Dominican Republic (14.4%, a difference of 0.63%), Houma (14.6%, a difference of 1.9%), and Apache (14.7%, a difference of 2.8%).
| Demographics | Rating | Rank | Family Poverty |
| Paiute | 0.0 /100 | #325 | Tragic 13.0% |
| Colville | 0.0 /100 | #326 | Tragic 13.0% |
| Yakama | 0.0 /100 | #327 | Tragic 13.1% |
| Central American Indians | 0.0 /100 | #328 | Tragic 13.3% |
| Blacks/African Americans | 0.0 /100 | #329 | Tragic 13.3% |
| Natives/Alaskans | 0.0 /100 | #330 | Tragic 14.3% |
| Cheyenne | 0.0 /100 | #331 | Tragic 14.3% |
| Dominicans | 0.0 /100 | #332 | Tragic 14.3% |
| Immigrants | Dominican Republic | 0.0 /100 | #333 | Tragic 14.4% |
| Houma | 0.0 /100 | #334 | Tragic 14.6% |
| Apache | 0.0 /100 | #335 | Tragic 14.7% |
| Sioux | 0.0 /100 | #336 | Tragic 15.9% |
| Hopi | 0.0 /100 | #337 | Tragic 15.9% |
| Crow | 0.0 /100 | #338 | Tragic 16.1% |
| Yuman | 0.0 /100 | #339 | Tragic 16.6% |