Ukrainian vs Immigrants from Korea College, Under 1 year
COMPARE
Ukrainian
Immigrants from Korea
College, Under 1 year
College, Under 1 year Comparison
Ukrainians
Immigrants from Korea
67.7%
COLLEGE, UNDER 1 YEAR
95.8/ 100
METRIC RATING
111th/ 347
METRIC RANK
71.6%
COLLEGE, UNDER 1 YEAR
100.0/ 100
METRIC RATING
20th/ 347
METRIC RANK
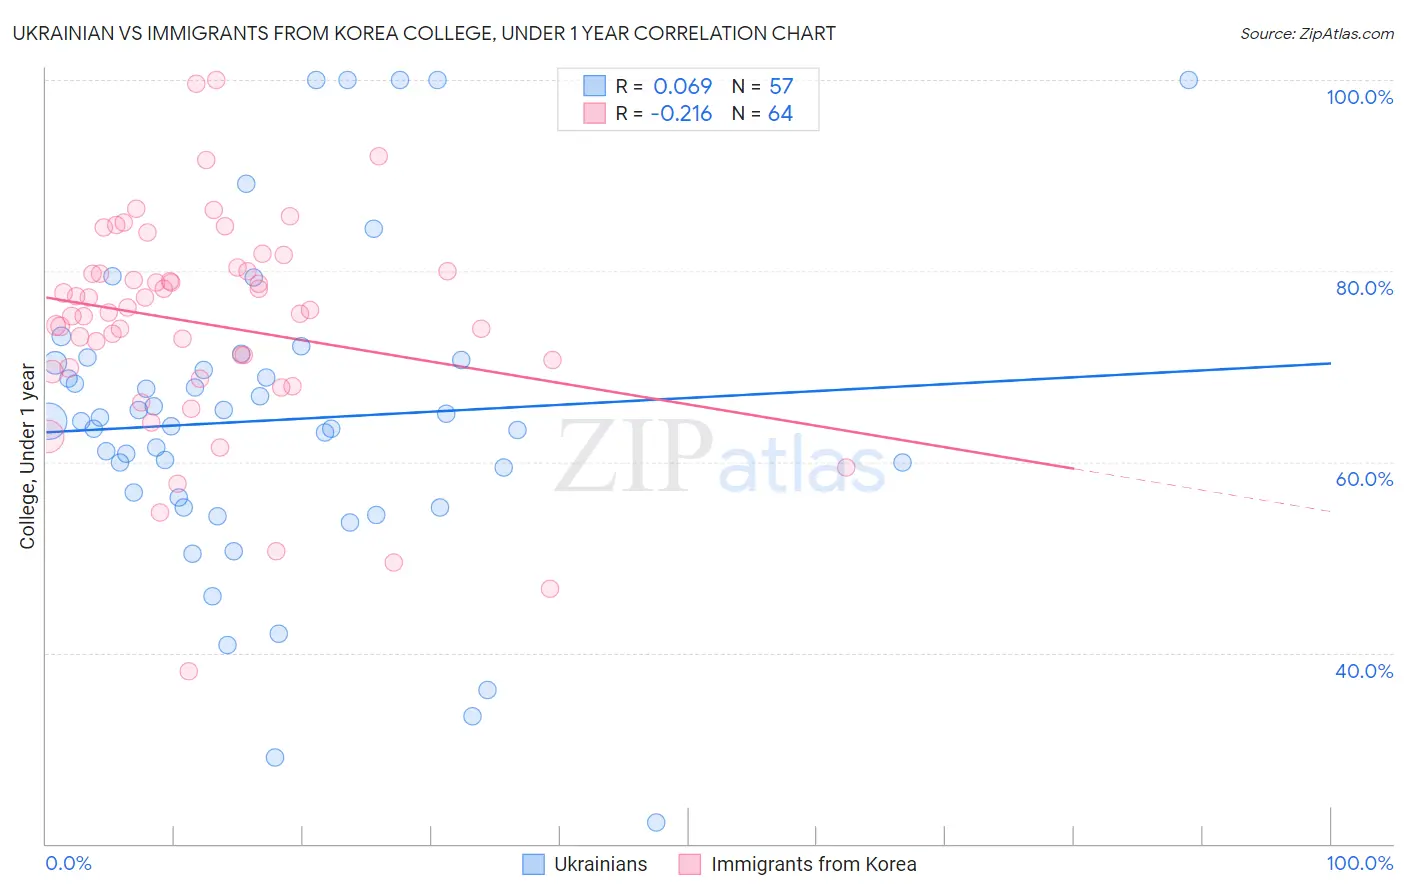
Ukrainian vs Immigrants from Korea College, Under 1 year Correlation Chart
The statistical analysis conducted on geographies consisting of 448,695,066 people shows a slight positive correlation between the proportion of Ukrainians and percentage of population with at least college, under 1 year education in the United States with a correlation coefficient (R) of 0.069 and weighted average of 67.7%. Similarly, the statistical analysis conducted on geographies consisting of 416,336,700 people shows a weak negative correlation between the proportion of Immigrants from Korea and percentage of population with at least college, under 1 year education in the United States with a correlation coefficient (R) of -0.216 and weighted average of 71.6%, a difference of 5.8%.
College, Under 1 year Correlation Summary
| Measurement | Ukrainian | Immigrants from Korea |
| Minimum | 22.2% | 38.0% |
| Maximum | 100.0% | 100.0% |
| Range | 77.8% | 62.0% |
| Mean | 64.4% | 74.4% |
| Median | 64.2% | 75.8% |
| Interquartile 25% (IQ1) | 55.7% | 69.7% |
| Interquartile 75% (IQ3) | 70.5% | 80.0% |
| Interquartile Range (IQR) | 14.8% | 10.3% |
| Standard Deviation (Sample) | 16.6% | 11.4% |
| Standard Deviation (Population) | 16.5% | 11.3% |
Similar Demographics by College, Under 1 year
Demographics Similar to Ukrainians by College, Under 1 year
In terms of college, under 1 year, the demographic groups most similar to Ukrainians are Scandinavian (67.7%, a difference of 0.0%), Assyrian/Chaldean/Syriac (67.7%, a difference of 0.0%), Macedonian (67.6%, a difference of 0.020%), Syrian (67.6%, a difference of 0.040%), and Immigrants from Egypt (67.7%, a difference of 0.060%).
| Demographics | Rating | Rank | College, Under 1 year |
| Immigrants | Western Asia | 96.6 /100 | #104 | Exceptional 67.8% |
| Afghans | 96.6 /100 | #105 | Exceptional 67.8% |
| Immigrants | Croatia | 96.6 /100 | #106 | Exceptional 67.8% |
| Austrians | 96.4 /100 | #107 | Exceptional 67.8% |
| Immigrants | Egypt | 96.0 /100 | #108 | Exceptional 67.7% |
| Scandinavians | 95.8 /100 | #109 | Exceptional 67.7% |
| Assyrians/Chaldeans/Syriacs | 95.8 /100 | #110 | Exceptional 67.7% |
| Ukrainians | 95.8 /100 | #111 | Exceptional 67.7% |
| Macedonians | 95.7 /100 | #112 | Exceptional 67.6% |
| Syrians | 95.6 /100 | #113 | Exceptional 67.6% |
| Chileans | 95.3 /100 | #114 | Exceptional 67.6% |
| Basques | 95.2 /100 | #115 | Exceptional 67.6% |
| Immigrants | Nepal | 94.9 /100 | #116 | Exceptional 67.5% |
| Pakistanis | 94.8 /100 | #117 | Exceptional 67.5% |
| Immigrants | Ukraine | 94.7 /100 | #118 | Exceptional 67.5% |
Demographics Similar to Immigrants from Korea by College, Under 1 year
In terms of college, under 1 year, the demographic groups most similar to Immigrants from Korea are Latvian (71.6%, a difference of 0.040%), Immigrants from Switzerland (71.7%, a difference of 0.15%), Immigrants from Belgium (71.5%, a difference of 0.15%), Eastern European (71.8%, a difference of 0.28%), and Immigrants from Eastern Asia (71.3%, a difference of 0.40%).
| Demographics | Rating | Rank | College, Under 1 year |
| Cypriots | 100.0 /100 | #13 | Exceptional 72.0% |
| Cambodians | 100.0 /100 | #14 | Exceptional 71.9% |
| Burmese | 100.0 /100 | #15 | Exceptional 71.9% |
| Immigrants | Japan | 100.0 /100 | #16 | Exceptional 71.9% |
| Eastern Europeans | 100.0 /100 | #17 | Exceptional 71.8% |
| Immigrants | Switzerland | 100.0 /100 | #18 | Exceptional 71.7% |
| Latvians | 100.0 /100 | #19 | Exceptional 71.6% |
| Immigrants | Korea | 100.0 /100 | #20 | Exceptional 71.6% |
| Immigrants | Belgium | 100.0 /100 | #21 | Exceptional 71.5% |
| Immigrants | Eastern Asia | 100.0 /100 | #22 | Exceptional 71.3% |
| Immigrants | Northern Europe | 100.0 /100 | #23 | Exceptional 71.1% |
| Soviet Union | 100.0 /100 | #24 | Exceptional 71.1% |
| Bulgarians | 100.0 /100 | #25 | Exceptional 71.1% |
| Immigrants | Denmark | 100.0 /100 | #26 | Exceptional 71.0% |
| Immigrants | Ireland | 100.0 /100 | #27 | Exceptional 71.0% |