Ukrainian vs Immigrants from Asia Unemployment Among Women with Children Ages 6 to 17 years
COMPARE
Ukrainian
Immigrants from Asia
Unemployment Among Women with Children Ages 6 to 17 years
Unemployment Among Women with Children Ages 6 to 17 years Comparison
Ukrainians
Immigrants from Asia
8.9%
UNEMPLOYMENT AMONG WOMEN WITH CHILDREN AGES 6 TO 17 YEARS
59.7/ 100
METRIC RATING
164th/ 347
METRIC RANK
8.1%
UNEMPLOYMENT AMONG WOMEN WITH CHILDREN AGES 6 TO 17 YEARS
100.0/ 100
METRIC RATING
48th/ 347
METRIC RANK
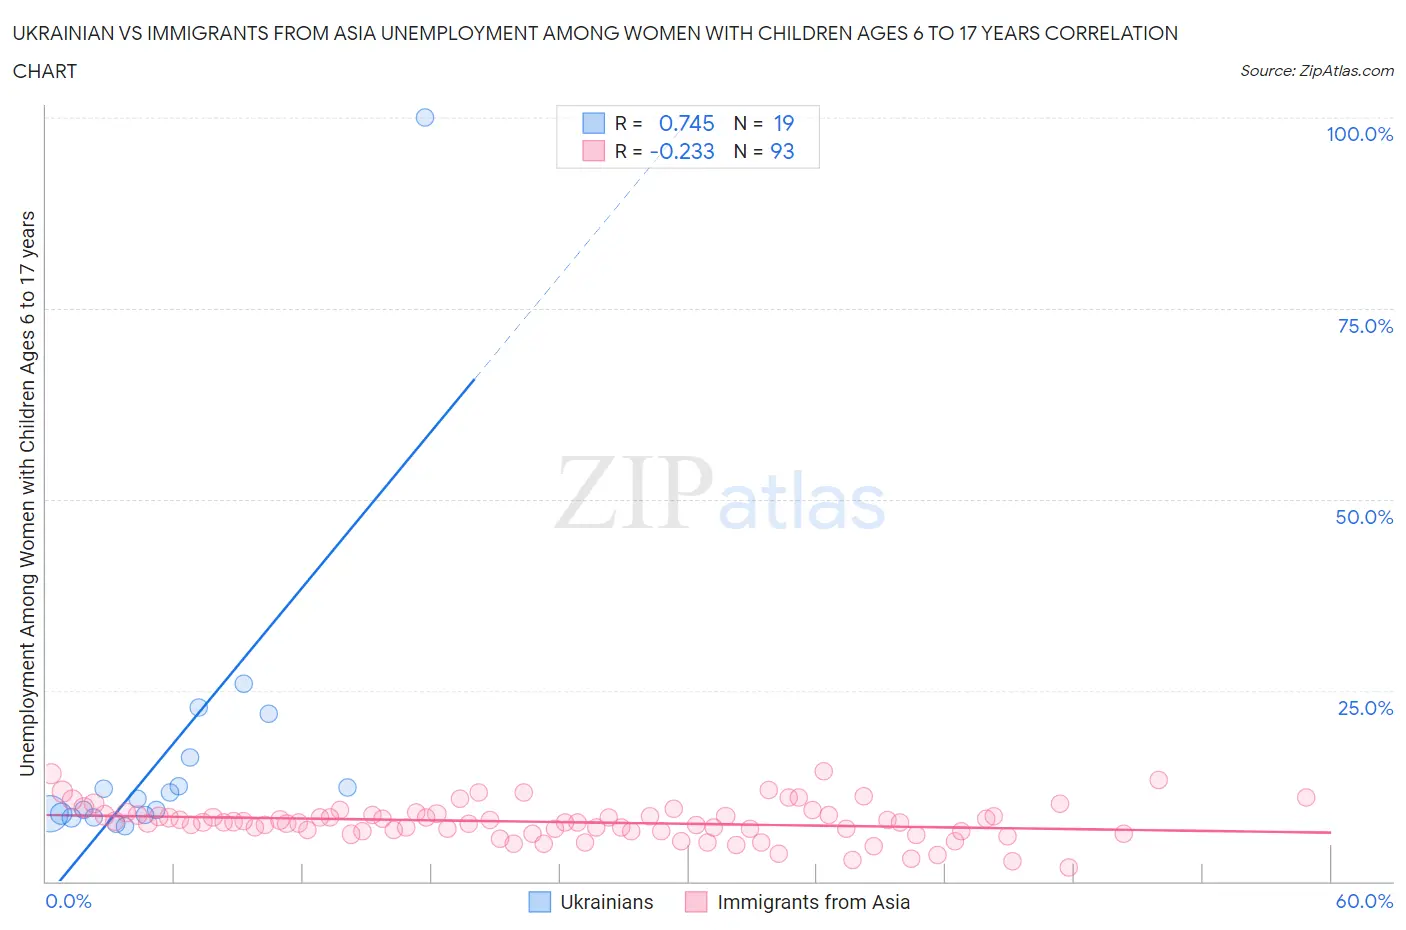
Ukrainian vs Immigrants from Asia Unemployment Among Women with Children Ages 6 to 17 years Correlation Chart
The statistical analysis conducted on geographies consisting of 304,599,225 people shows a strong positive correlation between the proportion of Ukrainians and unemployment rate among women with children between the ages 6 and 17 in the United States with a correlation coefficient (R) of 0.745 and weighted average of 8.9%. Similarly, the statistical analysis conducted on geographies consisting of 355,022,689 people shows a weak negative correlation between the proportion of Immigrants from Asia and unemployment rate among women with children between the ages 6 and 17 in the United States with a correlation coefficient (R) of -0.233 and weighted average of 8.1%, a difference of 10.5%.
Unemployment Among Women with Children Ages 6 to 17 years Correlation Summary
| Measurement | Ukrainian | Immigrants from Asia |
| Minimum | 7.2% | 1.9% |
| Maximum | 100.0% | 14.4% |
| Range | 92.8% | 12.6% |
| Mean | 17.0% | 7.8% |
| Median | 10.8% | 7.7% |
| Interquartile 25% (IQ1) | 8.7% | 6.5% |
| Interquartile 75% (IQ3) | 16.3% | 8.7% |
| Interquartile Range (IQR) | 7.6% | 2.1% |
| Standard Deviation (Sample) | 20.8% | 2.4% |
| Standard Deviation (Population) | 20.3% | 2.4% |
Similar Demographics by Unemployment Among Women with Children Ages 6 to 17 years
Demographics Similar to Ukrainians by Unemployment Among Women with Children Ages 6 to 17 years
In terms of unemployment among women with children ages 6 to 17 years, the demographic groups most similar to Ukrainians are Immigrants from Micronesia (8.9%, a difference of 0.020%), Mexican American Indian (8.9%, a difference of 0.040%), Immigrants from Netherlands (8.9%, a difference of 0.050%), Moroccan (8.9%, a difference of 0.060%), and Immigrants from England (8.9%, a difference of 0.090%).
| Demographics | Rating | Rank | Unemployment Among Women with Children Ages 6 to 17 years |
| Immigrants | Belgium | 65.6 /100 | #157 | Good 8.9% |
| Immigrants | Chile | 65.3 /100 | #158 | Good 8.9% |
| Spanish | 63.8 /100 | #159 | Good 8.9% |
| Immigrants | Hungary | 63.4 /100 | #160 | Good 8.9% |
| Immigrants | Guyana | 63.0 /100 | #161 | Good 8.9% |
| Immigrants | Netherlands | 60.8 /100 | #162 | Good 8.9% |
| Mexican American Indians | 60.6 /100 | #163 | Good 8.9% |
| Ukrainians | 59.7 /100 | #164 | Average 8.9% |
| Immigrants | Micronesia | 59.2 /100 | #165 | Average 8.9% |
| Moroccans | 58.3 /100 | #166 | Average 8.9% |
| Immigrants | England | 57.7 /100 | #167 | Average 8.9% |
| Immigrants | Croatia | 57.1 /100 | #168 | Average 8.9% |
| British | 55.2 /100 | #169 | Average 8.9% |
| Turks | 54.1 /100 | #170 | Average 8.9% |
| Jordanians | 52.2 /100 | #171 | Average 9.0% |
Demographics Similar to Immigrants from Asia by Unemployment Among Women with Children Ages 6 to 17 years
In terms of unemployment among women with children ages 6 to 17 years, the demographic groups most similar to Immigrants from Asia are Immigrants from Oceania (8.1%, a difference of 0.060%), Immigrants from Switzerland (8.1%, a difference of 0.13%), Hawaiian (8.1%, a difference of 0.16%), Icelander (8.1%, a difference of 0.17%), and Immigrants from Bulgaria (8.1%, a difference of 0.18%).
| Demographics | Rating | Rank | Unemployment Among Women with Children Ages 6 to 17 years |
| Iranians | 100.0 /100 | #41 | Exceptional 8.0% |
| Immigrants | Somalia | 100.0 /100 | #42 | Exceptional 8.0% |
| Bhutanese | 100.0 /100 | #43 | Exceptional 8.1% |
| Immigrants | Sweden | 100.0 /100 | #44 | Exceptional 8.1% |
| Immigrants | Bulgaria | 100.0 /100 | #45 | Exceptional 8.1% |
| Icelanders | 100.0 /100 | #46 | Exceptional 8.1% |
| Immigrants | Switzerland | 100.0 /100 | #47 | Exceptional 8.1% |
| Immigrants | Asia | 100.0 /100 | #48 | Exceptional 8.1% |
| Immigrants | Oceania | 100.0 /100 | #49 | Exceptional 8.1% |
| Hawaiians | 100.0 /100 | #50 | Exceptional 8.1% |
| Immigrants | Sudan | 100.0 /100 | #51 | Exceptional 8.1% |
| Immigrants | Iraq | 100.0 /100 | #52 | Exceptional 8.1% |
| Danes | 100.0 /100 | #53 | Exceptional 8.1% |
| Immigrants | Armenia | 100.0 /100 | #54 | Exceptional 8.2% |
| Immigrants | Japan | 100.0 /100 | #55 | Exceptional 8.2% |