Ugandan vs Immigrants from France Female Poverty Among 25-34 Year Olds
COMPARE
Ugandan
Immigrants from France
Female Poverty Among 25-34 Year Olds
Female Poverty Among 25-34 Year Olds Comparison
Ugandans
Immigrants from France
13.4%
FEMALE POVERTY AMONG 25-34 YEAR OLDS
64.1/ 100
METRIC RATING
162nd/ 347
METRIC RANK
12.6%
FEMALE POVERTY AMONG 25-34 YEAR OLDS
96.8/ 100
METRIC RATING
94th/ 347
METRIC RANK
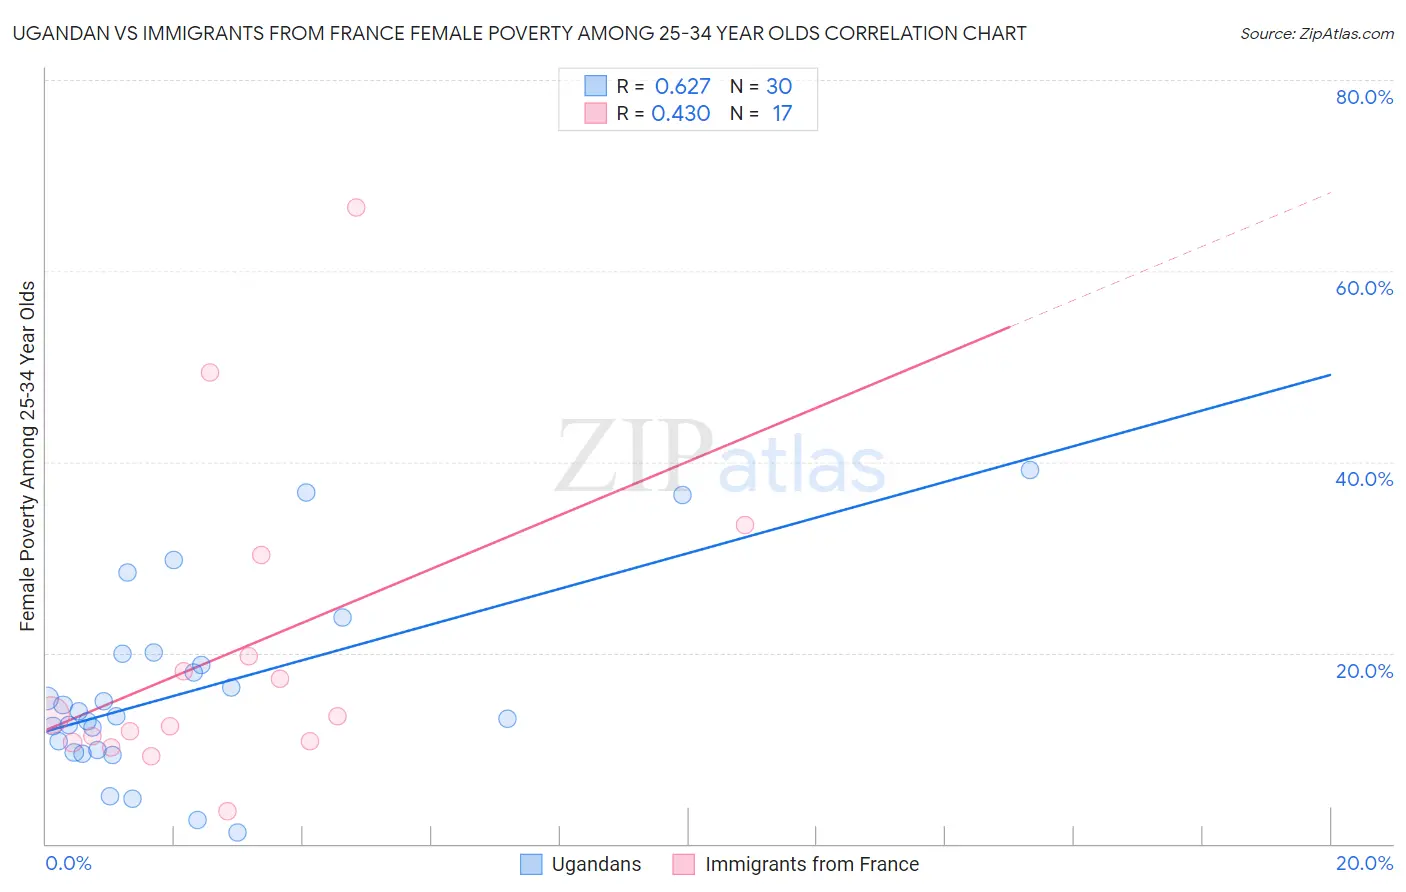
Ugandan vs Immigrants from France Female Poverty Among 25-34 Year Olds Correlation Chart
The statistical analysis conducted on geographies consisting of 93,638,275 people shows a significant positive correlation between the proportion of Ugandans and poverty level among females between the ages 25 and 34 in the United States with a correlation coefficient (R) of 0.627 and weighted average of 13.4%. Similarly, the statistical analysis conducted on geographies consisting of 284,403,921 people shows a moderate positive correlation between the proportion of Immigrants from France and poverty level among females between the ages 25 and 34 in the United States with a correlation coefficient (R) of 0.430 and weighted average of 12.6%, a difference of 6.3%.
Female Poverty Among 25-34 Year Olds Correlation Summary
| Measurement | Ugandan | Immigrants from France |
| Minimum | 1.2% | 3.4% |
| Maximum | 39.1% | 66.7% |
| Range | 38.0% | 63.3% |
| Mean | 16.1% | 20.1% |
| Median | 13.6% | 13.3% |
| Interquartile 25% (IQ1) | 9.9% | 10.7% |
| Interquartile 75% (IQ3) | 19.9% | 24.9% |
| Interquartile Range (IQR) | 10.0% | 14.2% |
| Standard Deviation (Sample) | 9.7% | 16.4% |
| Standard Deviation (Population) | 9.6% | 15.9% |
Similar Demographics by Female Poverty Among 25-34 Year Olds
Demographics Similar to Ugandans by Female Poverty Among 25-34 Year Olds
In terms of female poverty among 25-34 year olds, the demographic groups most similar to Ugandans are British (13.4%, a difference of 0.050%), Icelander (13.3%, a difference of 0.15%), Immigrants from South America (13.3%, a difference of 0.21%), Swiss (13.4%, a difference of 0.21%), and Uruguayan (13.3%, a difference of 0.26%).
| Demographics | Rating | Rank | Female Poverty Among 25-34 Year Olds |
| Immigrants | Sierra Leone | 72.9 /100 | #155 | Good 13.3% |
| Immigrants | Cameroon | 72.0 /100 | #156 | Good 13.3% |
| Immigrants | Western Europe | 70.3 /100 | #157 | Good 13.3% |
| Immigrants | Colombia | 69.2 /100 | #158 | Good 13.3% |
| Uruguayans | 66.9 /100 | #159 | Good 13.3% |
| Immigrants | South America | 66.3 /100 | #160 | Good 13.3% |
| Icelanders | 65.7 /100 | #161 | Good 13.3% |
| Ugandans | 64.1 /100 | #162 | Good 13.4% |
| British | 63.5 /100 | #163 | Good 13.4% |
| Swiss | 61.7 /100 | #164 | Good 13.4% |
| Basques | 59.3 /100 | #165 | Average 13.4% |
| Belgians | 58.9 /100 | #166 | Average 13.4% |
| Immigrants | Bosnia and Herzegovina | 58.6 /100 | #167 | Average 13.4% |
| Immigrants | Afghanistan | 57.7 /100 | #168 | Average 13.4% |
| Samoans | 56.8 /100 | #169 | Average 13.5% |
Demographics Similar to Immigrants from France by Female Poverty Among 25-34 Year Olds
In terms of female poverty among 25-34 year olds, the demographic groups most similar to Immigrants from France are Ukrainian (12.6%, a difference of 0.040%), Palestinian (12.6%, a difference of 0.050%), Immigrants from Zimbabwe (12.6%, a difference of 0.050%), Immigrants from Armenia (12.6%, a difference of 0.090%), and Norwegian (12.6%, a difference of 0.10%).
| Demographics | Rating | Rank | Female Poverty Among 25-34 Year Olds |
| Argentineans | 97.5 /100 | #87 | Exceptional 12.5% |
| Immigrants | Austria | 97.4 /100 | #88 | Exceptional 12.5% |
| Italians | 97.2 /100 | #89 | Exceptional 12.5% |
| Immigrants | Albania | 97.1 /100 | #90 | Exceptional 12.5% |
| Norwegians | 96.9 /100 | #91 | Exceptional 12.6% |
| Immigrants | Armenia | 96.9 /100 | #92 | Exceptional 12.6% |
| Palestinians | 96.9 /100 | #93 | Exceptional 12.6% |
| Immigrants | France | 96.8 /100 | #94 | Exceptional 12.6% |
| Ukrainians | 96.7 /100 | #95 | Exceptional 12.6% |
| Immigrants | Zimbabwe | 96.7 /100 | #96 | Exceptional 12.6% |
| Immigrants | Northern Africa | 96.6 /100 | #97 | Exceptional 12.6% |
| Immigrants | Ethiopia | 96.5 /100 | #98 | Exceptional 12.6% |
| Immigrants | Argentina | 96.4 /100 | #99 | Exceptional 12.6% |
| Immigrants | Denmark | 95.7 /100 | #100 | Exceptional 12.7% |
| Immigrants | Switzerland | 95.7 /100 | #101 | Exceptional 12.7% |