Immigrants from Zimbabwe vs Immigrants from France Single Mother Poverty
COMPARE
Immigrants from Zimbabwe
Immigrants from France
Single Mother Poverty
Single Mother Poverty Comparison
Immigrants from Zimbabwe
Immigrants from France
28.1%
SINGLE MOTHER POVERTY
95.5/ 100
METRIC RATING
108th/ 347
METRIC RANK
27.8%
SINGLE MOTHER POVERTY
98.2/ 100
METRIC RATING
90th/ 347
METRIC RANK
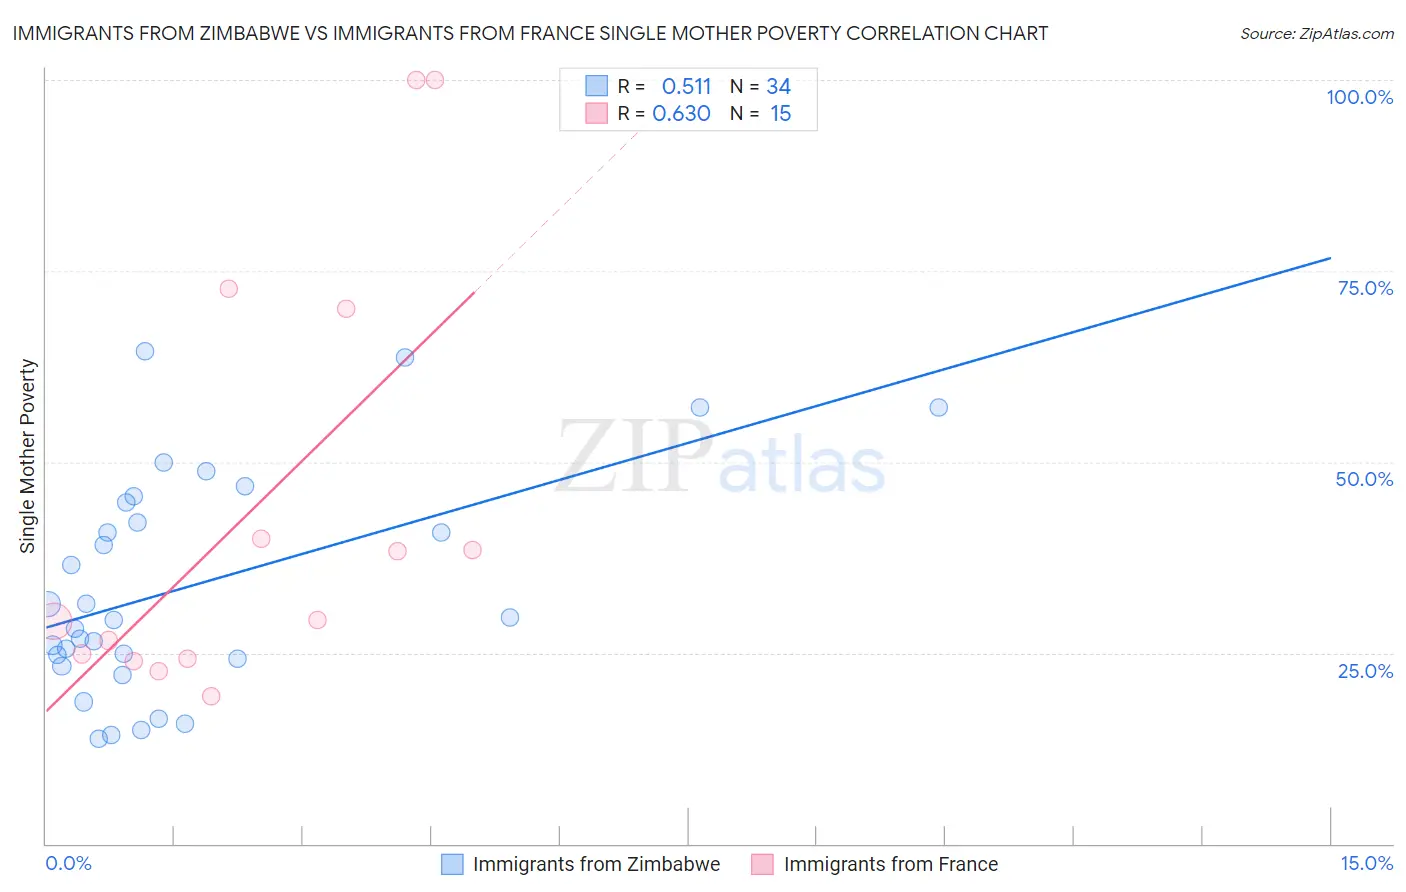
Immigrants from Zimbabwe vs Immigrants from France Single Mother Poverty Correlation Chart
The statistical analysis conducted on geographies consisting of 116,684,460 people shows a substantial positive correlation between the proportion of Immigrants from Zimbabwe and poverty level among single mothers in the United States with a correlation coefficient (R) of 0.511 and weighted average of 28.1%. Similarly, the statistical analysis conducted on geographies consisting of 281,639,013 people shows a significant positive correlation between the proportion of Immigrants from France and poverty level among single mothers in the United States with a correlation coefficient (R) of 0.630 and weighted average of 27.8%, a difference of 1.2%.
Single Mother Poverty Correlation Summary
| Measurement | Immigrants from Zimbabwe | Immigrants from France |
| Minimum | 13.8% | 19.4% |
| Maximum | 64.4% | 100.0% |
| Range | 50.6% | 80.6% |
| Mean | 33.7% | 44.0% |
| Median | 29.5% | 29.3% |
| Interquartile 25% (IQ1) | 24.3% | 24.3% |
| Interquartile 75% (IQ3) | 44.7% | 70.0% |
| Interquartile Range (IQR) | 20.4% | 45.7% |
| Standard Deviation (Sample) | 14.4% | 27.8% |
| Standard Deviation (Population) | 14.2% | 26.9% |
Demographics Similar to Immigrants from Zimbabwe and Immigrants from France by Single Mother Poverty
In terms of single mother poverty, the demographic groups most similar to Immigrants from Zimbabwe are Immigrants from Venezuela (28.1%, a difference of 0.080%), Immigrants from Armenia (28.1%, a difference of 0.090%), Ukrainian (28.0%, a difference of 0.29%), Israeli (28.0%, a difference of 0.33%), and Italian (28.0%, a difference of 0.35%). Similarly, the demographic groups most similar to Immigrants from France are Immigrants from Albania (27.8%, a difference of 0.14%), Estonian (27.8%, a difference of 0.17%), Immigrants from Ethiopia (27.7%, a difference of 0.18%), Romanian (27.8%, a difference of 0.26%), and Albanian (27.9%, a difference of 0.36%).
| Demographics | Rating | Rank | Single Mother Poverty |
| Immigrants | Ethiopia | 98.4 /100 | #89 | Exceptional 27.7% |
| Immigrants | France | 98.2 /100 | #90 | Exceptional 27.8% |
| Immigrants | Albania | 98.0 /100 | #91 | Exceptional 27.8% |
| Estonians | 97.9 /100 | #92 | Exceptional 27.8% |
| Romanians | 97.8 /100 | #93 | Exceptional 27.8% |
| Albanians | 97.6 /100 | #94 | Exceptional 27.9% |
| Chileans | 97.5 /100 | #95 | Exceptional 27.9% |
| Immigrants | Iraq | 97.3 /100 | #96 | Exceptional 27.9% |
| Immigrants | Brazil | 97.2 /100 | #97 | Exceptional 27.9% |
| Immigrants | Nepal | 97.2 /100 | #98 | Exceptional 27.9% |
| Immigrants | Netherlands | 97.2 /100 | #99 | Exceptional 27.9% |
| Zimbabweans | 97.1 /100 | #100 | Exceptional 27.9% |
| Pakistanis | 96.9 /100 | #101 | Exceptional 28.0% |
| Immigrants | Croatia | 96.7 /100 | #102 | Exceptional 28.0% |
| Immigrants | Northern Africa | 96.6 /100 | #103 | Exceptional 28.0% |
| Italians | 96.6 /100 | #104 | Exceptional 28.0% |
| Israelis | 96.5 /100 | #105 | Exceptional 28.0% |
| Ukrainians | 96.4 /100 | #106 | Exceptional 28.0% |
| Immigrants | Venezuela | 95.8 /100 | #107 | Exceptional 28.1% |
| Immigrants | Zimbabwe | 95.5 /100 | #108 | Exceptional 28.1% |
| Immigrants | Armenia | 95.2 /100 | #109 | Exceptional 28.1% |