Ugandan vs Cajun Child Poverty Among Girls Under 16
COMPARE
Ugandan
Cajun
Child Poverty Among Girls Under 16
Child Poverty Among Girls Under 16 Comparison
Ugandans
Cajuns
17.2%
CHILD POVERTY AMONG GIRLS UNDER 16
17.5/ 100
METRIC RATING
203rd/ 347
METRIC RANK
22.6%
CHILD POVERTY AMONG GIRLS UNDER 16
0.0/ 100
METRIC RATING
323rd/ 347
METRIC RANK
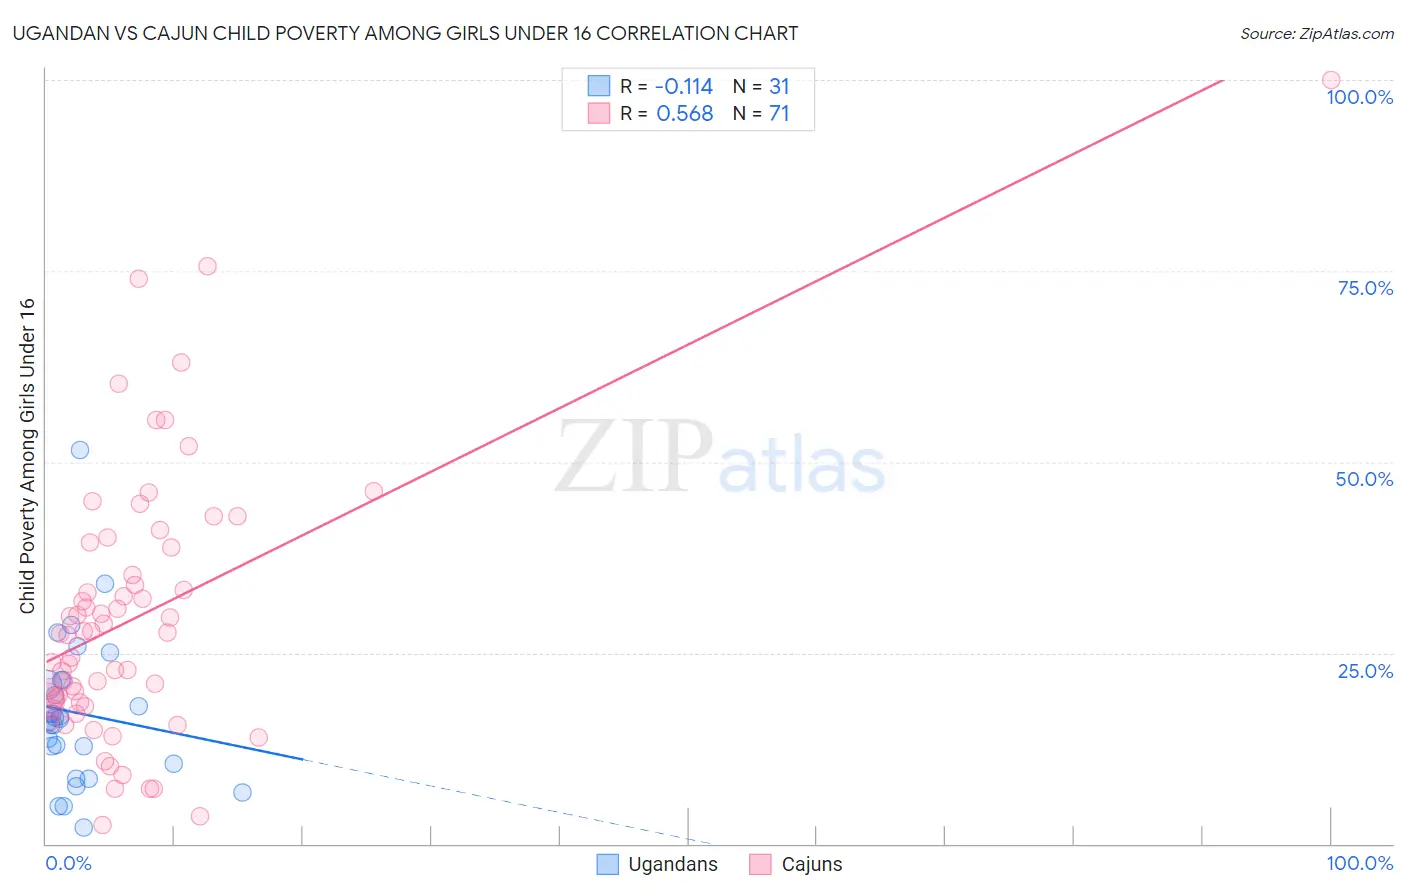
Ugandan vs Cajun Child Poverty Among Girls Under 16 Correlation Chart
The statistical analysis conducted on geographies consisting of 93,523,032 people shows a poor negative correlation between the proportion of Ugandans and poverty level among girls under the age of 16 in the United States with a correlation coefficient (R) of -0.114 and weighted average of 17.2%. Similarly, the statistical analysis conducted on geographies consisting of 148,672,718 people shows a substantial positive correlation between the proportion of Cajuns and poverty level among girls under the age of 16 in the United States with a correlation coefficient (R) of 0.568 and weighted average of 22.6%, a difference of 31.2%.
Child Poverty Among Girls Under 16 Correlation Summary
| Measurement | Ugandan | Cajun |
| Minimum | 2.1% | 2.5% |
| Maximum | 51.6% | 100.0% |
| Range | 49.5% | 97.5% |
| Mean | 17.1% | 29.6% |
| Median | 16.4% | 27.5% |
| Interquartile 25% (IQ1) | 10.5% | 18.6% |
| Interquartile 75% (IQ3) | 21.5% | 38.9% |
| Interquartile Range (IQR) | 10.9% | 20.3% |
| Standard Deviation (Sample) | 9.8% | 17.7% |
| Standard Deviation (Population) | 9.7% | 17.6% |
Similar Demographics by Child Poverty Among Girls Under 16
Demographics Similar to Ugandans by Child Poverty Among Girls Under 16
In terms of child poverty among girls under 16, the demographic groups most similar to Ugandans are Immigrants from Sierra Leone (17.2%, a difference of 0.010%), Immigrants from Kenya (17.2%, a difference of 0.060%), Immigrants from Uzbekistan (17.1%, a difference of 0.70%), Immigrants from Afghanistan (17.1%, a difference of 0.85%), and Immigrants from Lebanon (17.1%, a difference of 0.88%).
| Demographics | Rating | Rank | Child Poverty Among Girls Under 16 |
| Celtics | 25.2 /100 | #196 | Fair 17.0% |
| Spaniards | 24.9 /100 | #197 | Fair 17.0% |
| Immigrants | Lebanon | 22.6 /100 | #198 | Fair 17.1% |
| Immigrants | Afghanistan | 22.4 /100 | #199 | Fair 17.1% |
| Immigrants | Uzbekistan | 21.5 /100 | #200 | Fair 17.1% |
| Immigrants | Kenya | 17.8 /100 | #201 | Poor 17.2% |
| Immigrants | Sierra Leone | 17.6 /100 | #202 | Poor 17.2% |
| Ugandans | 17.5 /100 | #203 | Poor 17.2% |
| Iraqis | 13.0 /100 | #204 | Poor 17.4% |
| Immigrants | Cameroon | 12.6 /100 | #205 | Poor 17.4% |
| Delaware | 11.5 /100 | #206 | Poor 17.4% |
| Hmong | 10.6 /100 | #207 | Poor 17.5% |
| Sierra Leoneans | 8.9 /100 | #208 | Tragic 17.6% |
| Panamanians | 8.7 /100 | #209 | Tragic 17.6% |
| Immigrants | Immigrants | 7.3 /100 | #210 | Tragic 17.7% |
Demographics Similar to Cajuns by Child Poverty Among Girls Under 16
In terms of child poverty among girls under 16, the demographic groups most similar to Cajuns are Yakama (22.6%, a difference of 0.020%), Colville (22.5%, a difference of 0.21%), Paiute (22.6%, a difference of 0.29%), Immigrants from Congo (22.7%, a difference of 0.79%), and Immigrants from Honduras (22.8%, a difference of 0.92%).
| Demographics | Rating | Rank | Child Poverty Among Girls Under 16 |
| Immigrants | Guatemala | 0.0 /100 | #316 | Tragic 21.9% |
| Africans | 0.0 /100 | #317 | Tragic 21.9% |
| Immigrants | Dominica | 0.0 /100 | #318 | Tragic 22.1% |
| U.S. Virgin Islanders | 0.0 /100 | #319 | Tragic 22.1% |
| Hondurans | 0.0 /100 | #320 | Tragic 22.2% |
| Colville | 0.0 /100 | #321 | Tragic 22.5% |
| Yakama | 0.0 /100 | #322 | Tragic 22.6% |
| Cajuns | 0.0 /100 | #323 | Tragic 22.6% |
| Paiute | 0.0 /100 | #324 | Tragic 22.6% |
| Immigrants | Congo | 0.0 /100 | #325 | Tragic 22.7% |
| Immigrants | Honduras | 0.0 /100 | #326 | Tragic 22.8% |
| Central American Indians | 0.0 /100 | #327 | Tragic 22.8% |
| Dominicans | 0.0 /100 | #328 | Tragic 23.7% |
| Kiowa | 0.0 /100 | #329 | Tragic 23.7% |
| Immigrants | Dominican Republic | 0.0 /100 | #330 | Tragic 23.8% |