Ugandan vs Immigrants from Barbados Child Poverty Among Girls Under 16
COMPARE
Ugandan
Immigrants from Barbados
Child Poverty Among Girls Under 16
Child Poverty Among Girls Under 16 Comparison
Ugandans
Immigrants from Barbados
17.2%
CHILD POVERTY AMONG GIRLS UNDER 16
17.5/ 100
METRIC RATING
203rd/ 347
METRIC RANK
19.9%
CHILD POVERTY AMONG GIRLS UNDER 16
0.1/ 100
METRIC RATING
271st/ 347
METRIC RANK
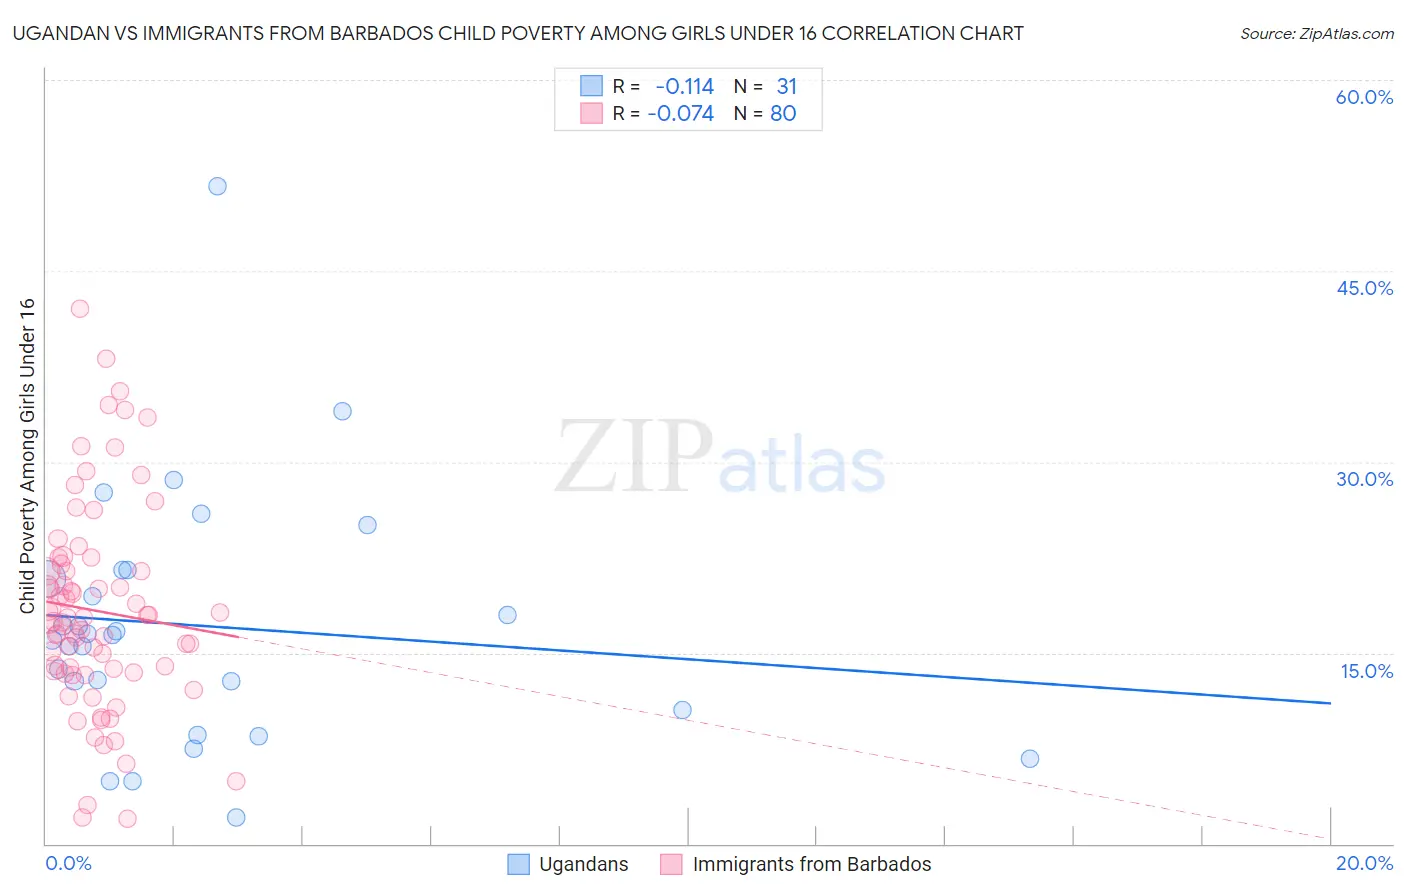
Ugandan vs Immigrants from Barbados Child Poverty Among Girls Under 16 Correlation Chart
The statistical analysis conducted on geographies consisting of 93,523,032 people shows a poor negative correlation between the proportion of Ugandans and poverty level among girls under the age of 16 in the United States with a correlation coefficient (R) of -0.114 and weighted average of 17.2%. Similarly, the statistical analysis conducted on geographies consisting of 112,076,716 people shows a slight negative correlation between the proportion of Immigrants from Barbados and poverty level among girls under the age of 16 in the United States with a correlation coefficient (R) of -0.074 and weighted average of 19.9%, a difference of 15.9%.
Child Poverty Among Girls Under 16 Correlation Summary
| Measurement | Ugandan | Immigrants from Barbados |
| Minimum | 2.1% | 2.0% |
| Maximum | 51.6% | 42.0% |
| Range | 49.5% | 40.0% |
| Mean | 17.1% | 18.3% |
| Median | 16.4% | 17.6% |
| Interquartile 25% (IQ1) | 10.5% | 13.5% |
| Interquartile 75% (IQ3) | 21.5% | 21.7% |
| Interquartile Range (IQR) | 10.9% | 8.2% |
| Standard Deviation (Sample) | 9.8% | 8.1% |
| Standard Deviation (Population) | 9.7% | 8.1% |
Similar Demographics by Child Poverty Among Girls Under 16
Demographics Similar to Ugandans by Child Poverty Among Girls Under 16
In terms of child poverty among girls under 16, the demographic groups most similar to Ugandans are Immigrants from Sierra Leone (17.2%, a difference of 0.010%), Immigrants from Kenya (17.2%, a difference of 0.060%), Immigrants from Uzbekistan (17.1%, a difference of 0.70%), Immigrants from Afghanistan (17.1%, a difference of 0.85%), and Immigrants from Lebanon (17.1%, a difference of 0.88%).
| Demographics | Rating | Rank | Child Poverty Among Girls Under 16 |
| Celtics | 25.2 /100 | #196 | Fair 17.0% |
| Spaniards | 24.9 /100 | #197 | Fair 17.0% |
| Immigrants | Lebanon | 22.6 /100 | #198 | Fair 17.1% |
| Immigrants | Afghanistan | 22.4 /100 | #199 | Fair 17.1% |
| Immigrants | Uzbekistan | 21.5 /100 | #200 | Fair 17.1% |
| Immigrants | Kenya | 17.8 /100 | #201 | Poor 17.2% |
| Immigrants | Sierra Leone | 17.6 /100 | #202 | Poor 17.2% |
| Ugandans | 17.5 /100 | #203 | Poor 17.2% |
| Iraqis | 13.0 /100 | #204 | Poor 17.4% |
| Immigrants | Cameroon | 12.6 /100 | #205 | Poor 17.4% |
| Delaware | 11.5 /100 | #206 | Poor 17.4% |
| Hmong | 10.6 /100 | #207 | Poor 17.5% |
| Sierra Leoneans | 8.9 /100 | #208 | Tragic 17.6% |
| Panamanians | 8.7 /100 | #209 | Tragic 17.6% |
| Immigrants | Immigrants | 7.3 /100 | #210 | Tragic 17.7% |
Demographics Similar to Immigrants from Barbados by Child Poverty Among Girls Under 16
In terms of child poverty among girls under 16, the demographic groups most similar to Immigrants from Barbados are Cherokee (19.9%, a difference of 0.10%), Immigrants from El Salvador (20.0%, a difference of 0.11%), Liberian (19.9%, a difference of 0.29%), Bangladeshi (20.0%, a difference of 0.31%), and Spanish American Indian (19.9%, a difference of 0.38%).
| Demographics | Rating | Rank | Child Poverty Among Girls Under 16 |
| Jamaicans | 0.1 /100 | #264 | Tragic 19.7% |
| Immigrants | Jamaica | 0.1 /100 | #265 | Tragic 19.8% |
| Spanish Americans | 0.1 /100 | #266 | Tragic 19.8% |
| Immigrants | Bangladesh | 0.1 /100 | #267 | Tragic 19.9% |
| Spanish American Indians | 0.1 /100 | #268 | Tragic 19.9% |
| Liberians | 0.1 /100 | #269 | Tragic 19.9% |
| Cherokee | 0.1 /100 | #270 | Tragic 19.9% |
| Immigrants | Barbados | 0.1 /100 | #271 | Tragic 19.9% |
| Immigrants | El Salvador | 0.1 /100 | #272 | Tragic 20.0% |
| Bangladeshis | 0.1 /100 | #273 | Tragic 20.0% |
| Immigrants | St. Vincent and the Grenadines | 0.0 /100 | #274 | Tragic 20.1% |
| Sub-Saharan Africans | 0.0 /100 | #275 | Tragic 20.1% |
| Comanche | 0.0 /100 | #276 | Tragic 20.2% |
| Belizeans | 0.0 /100 | #277 | Tragic 20.2% |
| Barbadians | 0.0 /100 | #278 | Tragic 20.2% |