Immigrants from Kazakhstan vs South American Single Mother Poverty
COMPARE
Immigrants from Kazakhstan
South American
Single Mother Poverty
Single Mother Poverty Comparison
Immigrants from Kazakhstan
South Americans
28.2%
SINGLE MOTHER POVERTY
94.5/ 100
METRIC RATING
112th/ 347
METRIC RANK
28.4%
SINGLE MOTHER POVERTY
90.4/ 100
METRIC RATING
129th/ 347
METRIC RANK
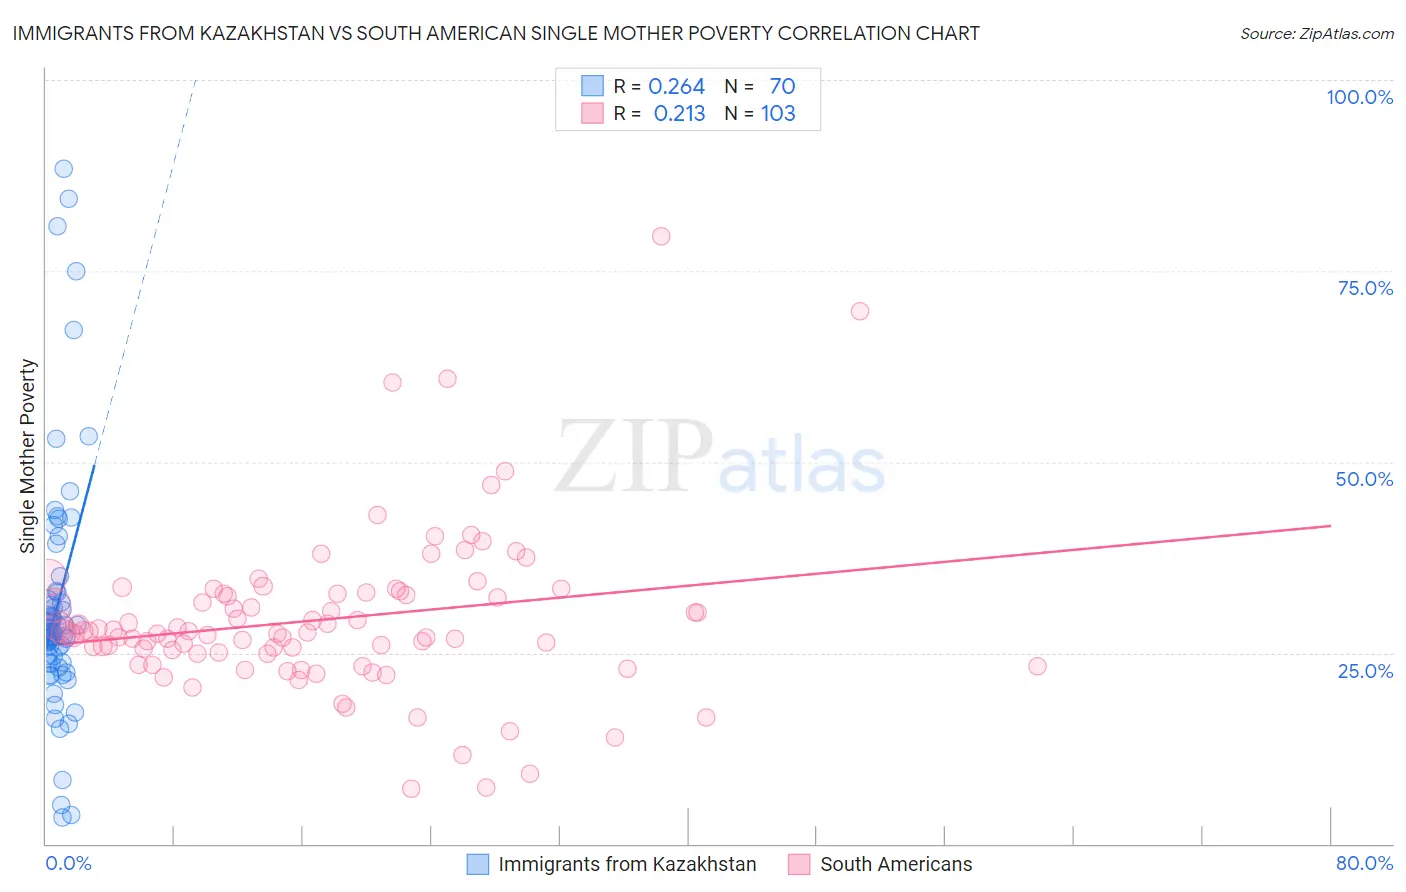
Immigrants from Kazakhstan vs South American Single Mother Poverty Correlation Chart
The statistical analysis conducted on geographies consisting of 123,126,284 people shows a weak positive correlation between the proportion of Immigrants from Kazakhstan and poverty level among single mothers in the United States with a correlation coefficient (R) of 0.264 and weighted average of 28.2%. Similarly, the statistical analysis conducted on geographies consisting of 477,647,095 people shows a weak positive correlation between the proportion of South Americans and poverty level among single mothers in the United States with a correlation coefficient (R) of 0.213 and weighted average of 28.4%, a difference of 0.74%.
Single Mother Poverty Correlation Summary
| Measurement | Immigrants from Kazakhstan | South American |
| Minimum | 3.4% | 7.3% |
| Maximum | 88.4% | 79.6% |
| Range | 85.0% | 72.3% |
| Mean | 31.4% | 29.3% |
| Median | 27.9% | 27.6% |
| Interquartile 25% (IQ1) | 23.7% | 24.9% |
| Interquartile 75% (IQ3) | 32.9% | 32.8% |
| Interquartile Range (IQR) | 9.2% | 7.9% |
| Standard Deviation (Sample) | 16.5% | 10.7% |
| Standard Deviation (Population) | 16.4% | 10.6% |
Demographics Similar to Immigrants from Kazakhstan and South Americans by Single Mother Poverty
In terms of single mother poverty, the demographic groups most similar to Immigrants from Kazakhstan are Venezuelan (28.2%, a difference of 0.010%), Croatian (28.2%, a difference of 0.060%), Immigrants from South Africa (28.3%, a difference of 0.28%), Immigrants from Western Asia (28.3%, a difference of 0.37%), and Immigrants from Kuwait (28.3%, a difference of 0.38%). Similarly, the demographic groups most similar to South Americans are Norwegian (28.4%, a difference of 0.0%), Immigrants from England (28.4%, a difference of 0.020%), Polish (28.4%, a difference of 0.060%), Kenyan (28.4%, a difference of 0.070%), and Immigrants from Chile (28.4%, a difference of 0.070%).
| Demographics | Rating | Rank | Single Mother Poverty |
| Croatians | 94.8 /100 | #110 | Exceptional 28.2% |
| Venezuelans | 94.5 /100 | #111 | Exceptional 28.2% |
| Immigrants | Kazakhstan | 94.5 /100 | #112 | Exceptional 28.2% |
| Immigrants | South Africa | 93.2 /100 | #113 | Exceptional 28.3% |
| Immigrants | Western Asia | 92.7 /100 | #114 | Exceptional 28.3% |
| Immigrants | Kuwait | 92.7 /100 | #115 | Exceptional 28.3% |
| Immigrants | Uganda | 92.5 /100 | #116 | Exceptional 28.3% |
| Australians | 92.5 /100 | #117 | Exceptional 28.3% |
| Brazilians | 92.4 /100 | #118 | Exceptional 28.3% |
| Immigrants | Syria | 92.4 /100 | #119 | Exceptional 28.3% |
| Cypriots | 92.3 /100 | #120 | Exceptional 28.3% |
| Immigrants | Afghanistan | 92.1 /100 | #121 | Exceptional 28.3% |
| Colombians | 91.8 /100 | #122 | Exceptional 28.3% |
| Uruguayans | 91.7 /100 | #123 | Exceptional 28.3% |
| Immigrants | Switzerland | 91.7 /100 | #124 | Exceptional 28.3% |
| Kenyans | 90.9 /100 | #125 | Exceptional 28.4% |
| Immigrants | Chile | 90.8 /100 | #126 | Exceptional 28.4% |
| Poles | 90.8 /100 | #127 | Exceptional 28.4% |
| Immigrants | England | 90.5 /100 | #128 | Exceptional 28.4% |
| South Americans | 90.4 /100 | #129 | Exceptional 28.4% |
| Norwegians | 90.4 /100 | #130 | Exceptional 28.4% |