Tsimshian vs Iroquois Female Poverty Among 25-34 Year Olds
COMPARE
Tsimshian
Iroquois
Female Poverty Among 25-34 Year Olds
Female Poverty Among 25-34 Year Olds Comparison
Tsimshian
Iroquois
12.7%
FEMALE POVERTY AMONG 25-34 YEAR OLDS
95.1/ 100
METRIC RATING
106th/ 347
METRIC RANK
17.5%
FEMALE POVERTY AMONG 25-34 YEAR OLDS
0.0/ 100
METRIC RATING
312th/ 347
METRIC RANK
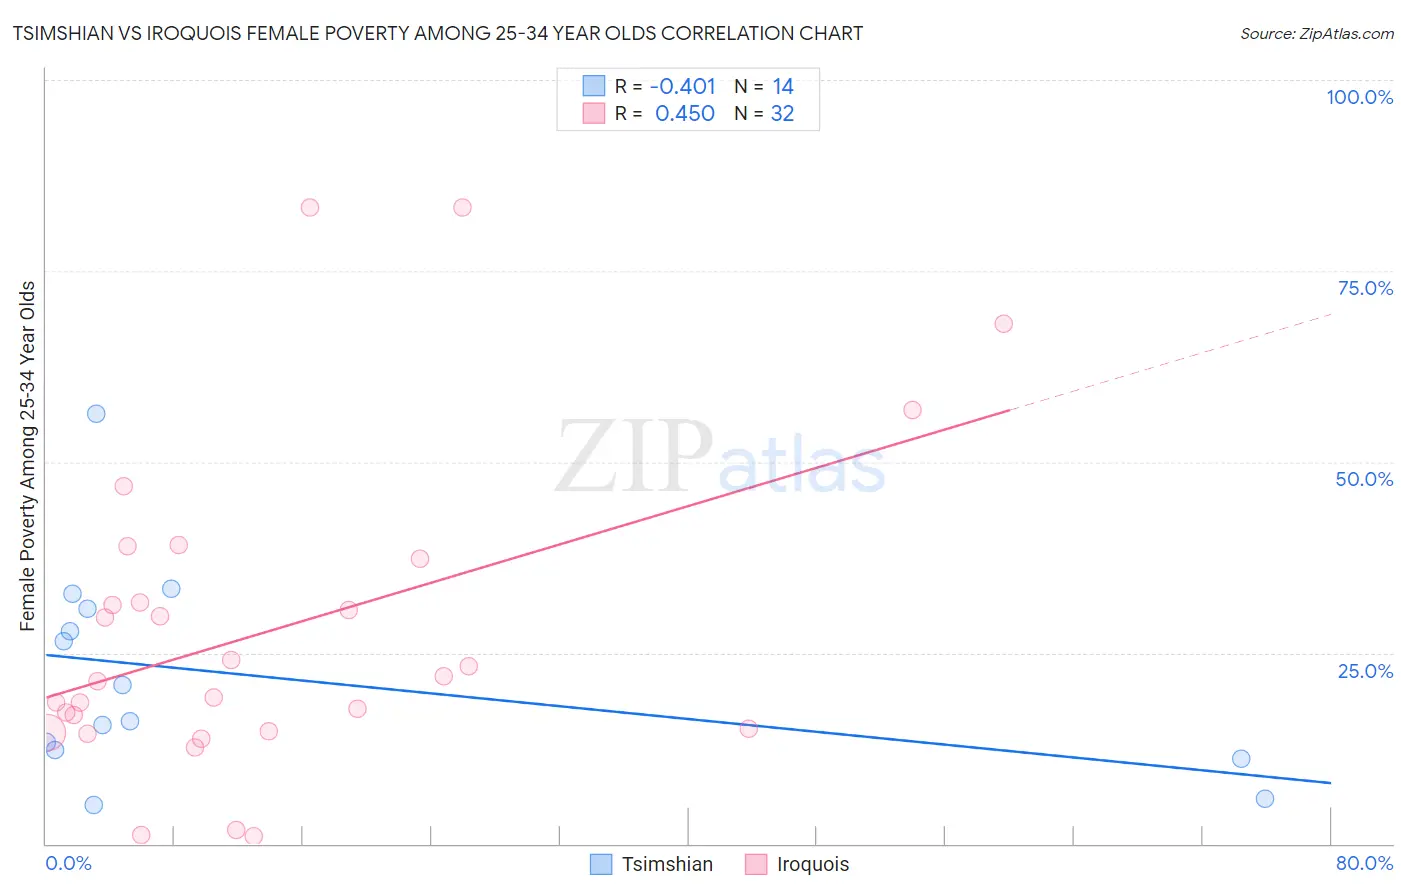
Tsimshian vs Iroquois Female Poverty Among 25-34 Year Olds Correlation Chart
The statistical analysis conducted on geographies consisting of 15,581,889 people shows a moderate negative correlation between the proportion of Tsimshian and poverty level among females between the ages 25 and 34 in the United States with a correlation coefficient (R) of -0.401 and weighted average of 12.7%. Similarly, the statistical analysis conducted on geographies consisting of 205,419,600 people shows a moderate positive correlation between the proportion of Iroquois and poverty level among females between the ages 25 and 34 in the United States with a correlation coefficient (R) of 0.450 and weighted average of 17.5%, a difference of 37.4%.
Female Poverty Among 25-34 Year Olds Correlation Summary
| Measurement | Tsimshian | Iroquois |
| Minimum | 5.0% | 0.99% |
| Maximum | 56.2% | 83.3% |
| Range | 51.2% | 82.3% |
| Mean | 21.9% | 27.9% |
| Median | 18.4% | 21.5% |
| Interquartile 25% (IQ1) | 12.2% | 14.8% |
| Interquartile 75% (IQ3) | 30.8% | 34.5% |
| Interquartile Range (IQR) | 18.6% | 19.6% |
| Standard Deviation (Sample) | 13.8% | 20.7% |
| Standard Deviation (Population) | 13.3% | 20.4% |
Similar Demographics by Female Poverty Among 25-34 Year Olds
Demographics Similar to Tsimshian by Female Poverty Among 25-34 Year Olds
In terms of female poverty among 25-34 year olds, the demographic groups most similar to Tsimshian are Polish (12.7%, a difference of 0.050%), Immigrants from South Africa (12.7%, a difference of 0.10%), Swedish (12.7%, a difference of 0.15%), Immigrants from Spain (12.7%, a difference of 0.20%), and Peruvian (12.7%, a difference of 0.26%).
| Demographics | Rating | Rank | Female Poverty Among 25-34 Year Olds |
| Immigrants | Argentina | 96.4 /100 | #99 | Exceptional 12.6% |
| Immigrants | Denmark | 95.7 /100 | #100 | Exceptional 12.7% |
| Immigrants | Switzerland | 95.7 /100 | #101 | Exceptional 12.7% |
| Peruvians | 95.6 /100 | #102 | Exceptional 12.7% |
| Immigrants | Spain | 95.5 /100 | #103 | Exceptional 12.7% |
| Swedes | 95.4 /100 | #104 | Exceptional 12.7% |
| Immigrants | South Africa | 95.3 /100 | #105 | Exceptional 12.7% |
| Tsimshian | 95.1 /100 | #106 | Exceptional 12.7% |
| Poles | 94.9 /100 | #107 | Exceptional 12.7% |
| Immigrants | Norway | 94.4 /100 | #108 | Exceptional 12.7% |
| Immigrants | Peru | 94.3 /100 | #109 | Exceptional 12.7% |
| Australians | 94.1 /100 | #110 | Exceptional 12.8% |
| Danes | 93.9 /100 | #111 | Exceptional 12.8% |
| Immigrants | Morocco | 93.9 /100 | #112 | Exceptional 12.8% |
| Immigrants | Syria | 93.8 /100 | #113 | Exceptional 12.8% |
Demographics Similar to Iroquois by Female Poverty Among 25-34 Year Olds
In terms of female poverty among 25-34 year olds, the demographic groups most similar to Iroquois are Colville (17.5%, a difference of 0.080%), Immigrants from Dominican Republic (17.6%, a difference of 0.76%), Yakama (17.6%, a difference of 0.98%), Dominican (17.6%, a difference of 0.98%), and Immigrants from Honduras (17.3%, a difference of 1.1%).
| Demographics | Rating | Rank | Female Poverty Among 25-34 Year Olds |
| Immigrants | Cabo Verde | 0.0 /100 | #305 | Tragic 16.9% |
| Chickasaw | 0.0 /100 | #306 | Tragic 17.0% |
| Yaqui | 0.0 /100 | #307 | Tragic 17.0% |
| Africans | 0.0 /100 | #308 | Tragic 17.0% |
| Ottawa | 0.0 /100 | #309 | Tragic 17.1% |
| Cherokee | 0.0 /100 | #310 | Tragic 17.2% |
| Immigrants | Honduras | 0.0 /100 | #311 | Tragic 17.3% |
| Iroquois | 0.0 /100 | #312 | Tragic 17.5% |
| Colville | 0.0 /100 | #313 | Tragic 17.5% |
| Immigrants | Dominican Republic | 0.0 /100 | #314 | Tragic 17.6% |
| Yakama | 0.0 /100 | #315 | Tragic 17.6% |
| Dominicans | 0.0 /100 | #316 | Tragic 17.6% |
| Arapaho | 0.0 /100 | #317 | Tragic 17.8% |
| Ute | 0.0 /100 | #318 | Tragic 17.9% |
| Menominee | 0.0 /100 | #319 | Tragic 18.0% |