Immigrants from Hong Kong vs Iroquois Female Poverty Among 25-34 Year Olds
COMPARE
Immigrants from Hong Kong
Iroquois
Female Poverty Among 25-34 Year Olds
Female Poverty Among 25-34 Year Olds Comparison
Immigrants from Hong Kong
Iroquois
10.4%
FEMALE POVERTY AMONG 25-34 YEAR OLDS
100.0/ 100
METRIC RATING
5th/ 347
METRIC RANK
17.5%
FEMALE POVERTY AMONG 25-34 YEAR OLDS
0.0/ 100
METRIC RATING
312th/ 347
METRIC RANK
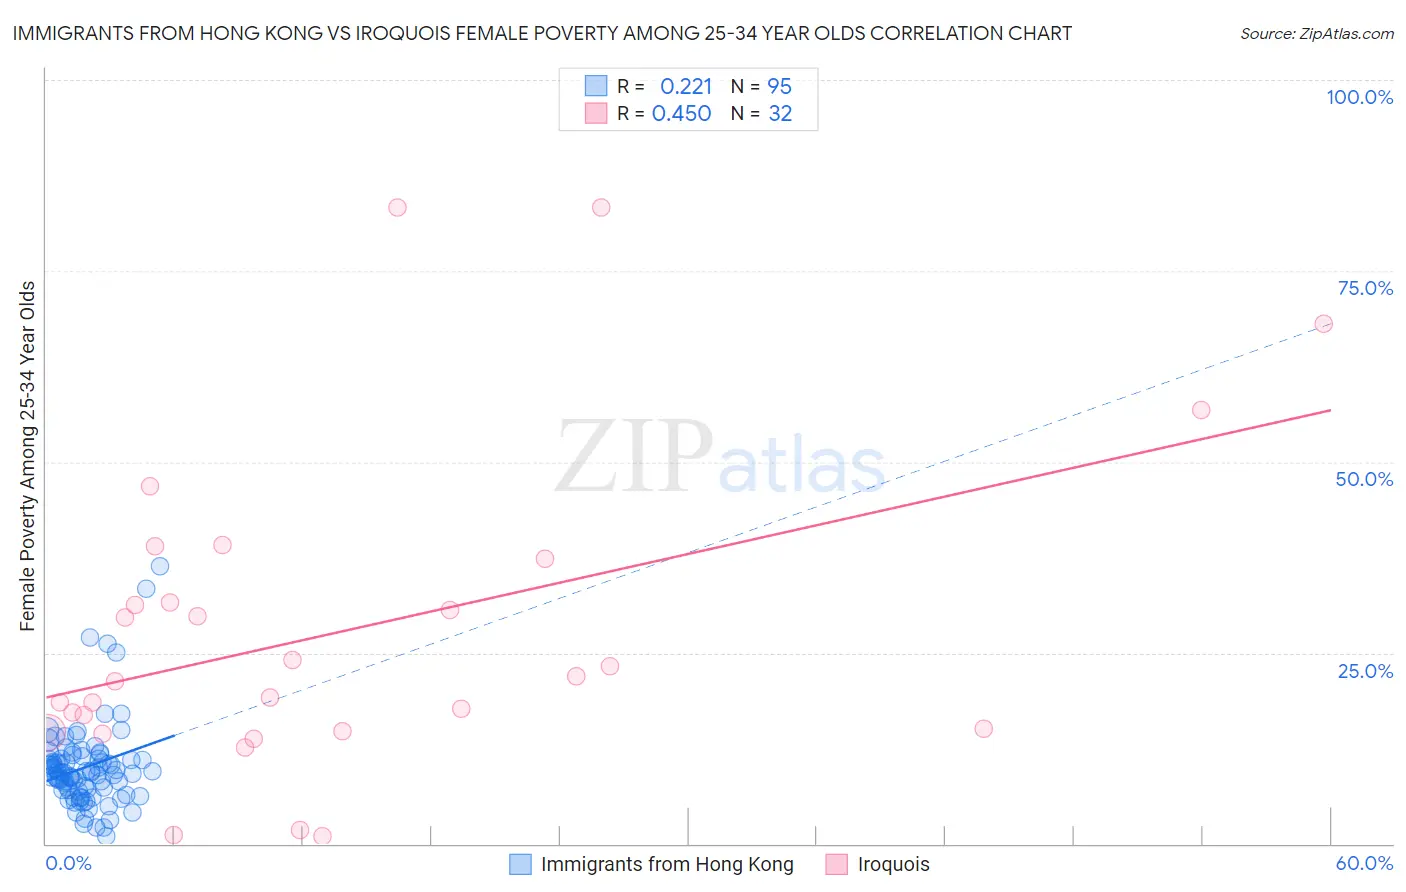
Immigrants from Hong Kong vs Iroquois Female Poverty Among 25-34 Year Olds Correlation Chart
The statistical analysis conducted on geographies consisting of 250,705,570 people shows a weak positive correlation between the proportion of Immigrants from Hong Kong and poverty level among females between the ages 25 and 34 in the United States with a correlation coefficient (R) of 0.221 and weighted average of 10.4%. Similarly, the statistical analysis conducted on geographies consisting of 205,419,600 people shows a moderate positive correlation between the proportion of Iroquois and poverty level among females between the ages 25 and 34 in the United States with a correlation coefficient (R) of 0.450 and weighted average of 17.5%, a difference of 68.3%.
Female Poverty Among 25-34 Year Olds Correlation Summary
| Measurement | Immigrants from Hong Kong | Iroquois |
| Minimum | 1.0% | 0.99% |
| Maximum | 36.4% | 83.3% |
| Range | 35.3% | 82.3% |
| Mean | 10.1% | 27.9% |
| Median | 9.4% | 21.5% |
| Interquartile 25% (IQ1) | 7.0% | 14.8% |
| Interquartile 75% (IQ3) | 11.2% | 34.5% |
| Interquartile Range (IQR) | 4.2% | 19.6% |
| Standard Deviation (Sample) | 5.7% | 20.7% |
| Standard Deviation (Population) | 5.7% | 20.4% |
Similar Demographics by Female Poverty Among 25-34 Year Olds
Demographics Similar to Immigrants from Hong Kong by Female Poverty Among 25-34 Year Olds
In terms of female poverty among 25-34 year olds, the demographic groups most similar to Immigrants from Hong Kong are Thai (10.2%, a difference of 1.4%), Filipino (10.2%, a difference of 1.5%), Immigrants from Taiwan (10.0%, a difference of 3.6%), Immigrants from South Central Asia (10.8%, a difference of 3.7%), and Chinese (11.0%, a difference of 5.7%).
| Demographics | Rating | Rank | Female Poverty Among 25-34 Year Olds |
| Immigrants | India | 100.0 /100 | #1 | Exceptional 9.7% |
| Immigrants | Taiwan | 100.0 /100 | #2 | Exceptional 10.0% |
| Filipinos | 100.0 /100 | #3 | Exceptional 10.2% |
| Thais | 100.0 /100 | #4 | Exceptional 10.2% |
| Immigrants | Hong Kong | 100.0 /100 | #5 | Exceptional 10.4% |
| Immigrants | South Central Asia | 100.0 /100 | #6 | Exceptional 10.8% |
| Chinese | 100.0 /100 | #7 | Exceptional 11.0% |
| Immigrants | Iran | 100.0 /100 | #8 | Exceptional 11.0% |
| Immigrants | Singapore | 100.0 /100 | #9 | Exceptional 11.1% |
| Immigrants | Lithuania | 100.0 /100 | #10 | Exceptional 11.1% |
| Immigrants | Korea | 100.0 /100 | #11 | Exceptional 11.1% |
| Immigrants | Ireland | 100.0 /100 | #12 | Exceptional 11.2% |
| Burmese | 100.0 /100 | #13 | Exceptional 11.2% |
| Indians (Asian) | 100.0 /100 | #14 | Exceptional 11.2% |
| Assyrians/Chaldeans/Syriacs | 100.0 /100 | #15 | Exceptional 11.2% |
Demographics Similar to Iroquois by Female Poverty Among 25-34 Year Olds
In terms of female poverty among 25-34 year olds, the demographic groups most similar to Iroquois are Colville (17.5%, a difference of 0.080%), Immigrants from Dominican Republic (17.6%, a difference of 0.76%), Yakama (17.6%, a difference of 0.98%), Dominican (17.6%, a difference of 0.98%), and Immigrants from Honduras (17.3%, a difference of 1.1%).
| Demographics | Rating | Rank | Female Poverty Among 25-34 Year Olds |
| Immigrants | Cabo Verde | 0.0 /100 | #305 | Tragic 16.9% |
| Chickasaw | 0.0 /100 | #306 | Tragic 17.0% |
| Yaqui | 0.0 /100 | #307 | Tragic 17.0% |
| Africans | 0.0 /100 | #308 | Tragic 17.0% |
| Ottawa | 0.0 /100 | #309 | Tragic 17.1% |
| Cherokee | 0.0 /100 | #310 | Tragic 17.2% |
| Immigrants | Honduras | 0.0 /100 | #311 | Tragic 17.3% |
| Iroquois | 0.0 /100 | #312 | Tragic 17.5% |
| Colville | 0.0 /100 | #313 | Tragic 17.5% |
| Immigrants | Dominican Republic | 0.0 /100 | #314 | Tragic 17.6% |
| Yakama | 0.0 /100 | #315 | Tragic 17.6% |
| Dominicans | 0.0 /100 | #316 | Tragic 17.6% |
| Arapaho | 0.0 /100 | #317 | Tragic 17.8% |
| Ute | 0.0 /100 | #318 | Tragic 17.9% |
| Menominee | 0.0 /100 | #319 | Tragic 18.0% |