Immigrants from Ireland vs Belizean Child Poverty Under the Age of 5
COMPARE
Immigrants from Ireland
Belizean
Child Poverty Under the Age of 5
Child Poverty Under the Age of 5 Comparison
Immigrants from Ireland
Belizeans
13.7%
CHILD POVERTY UNDER THE AGE OF 5
100.0/ 100
METRIC RATING
19th/ 347
METRIC RANK
20.3%
CHILD POVERTY UNDER THE AGE OF 5
0.1/ 100
METRIC RATING
268th/ 347
METRIC RANK
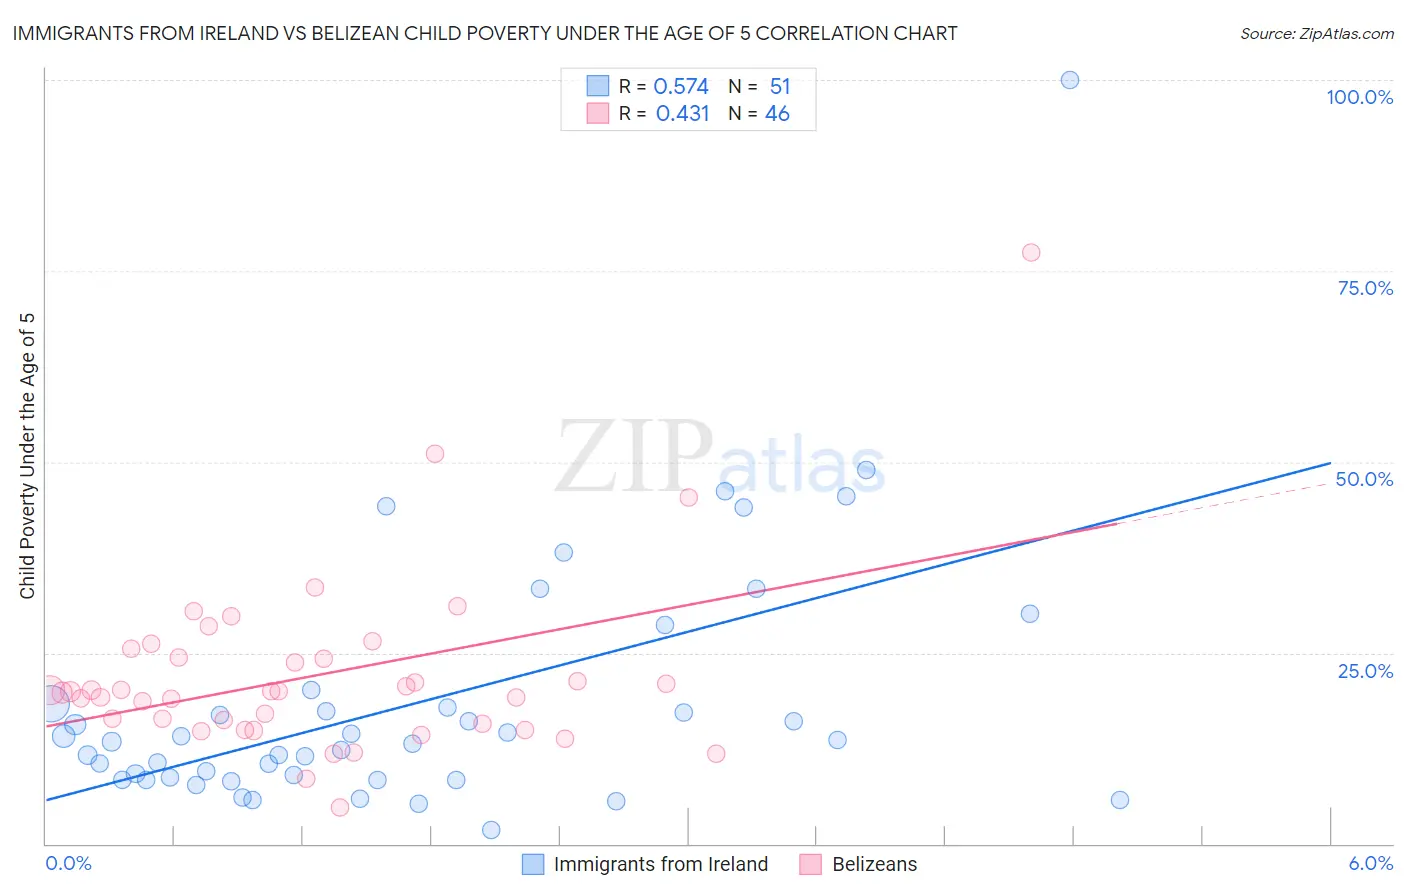
Immigrants from Ireland vs Belizean Child Poverty Under the Age of 5 Correlation Chart
The statistical analysis conducted on geographies consisting of 230,283,967 people shows a substantial positive correlation between the proportion of Immigrants from Ireland and poverty level among children under the age of 5 in the United States with a correlation coefficient (R) of 0.574 and weighted average of 13.7%. Similarly, the statistical analysis conducted on geographies consisting of 142,931,815 people shows a moderate positive correlation between the proportion of Belizeans and poverty level among children under the age of 5 in the United States with a correlation coefficient (R) of 0.431 and weighted average of 20.3%, a difference of 48.2%.
Child Poverty Under the Age of 5 Correlation Summary
| Measurement | Immigrants from Ireland | Belizean |
| Minimum | 1.7% | 4.8% |
| Maximum | 100.0% | 77.4% |
| Range | 98.3% | 72.6% |
| Mean | 18.5% | 22.1% |
| Median | 13.4% | 19.9% |
| Interquartile 25% (IQ1) | 8.4% | 15.6% |
| Interquartile 75% (IQ3) | 18.3% | 24.3% |
| Interquartile Range (IQR) | 9.9% | 8.7% |
| Standard Deviation (Sample) | 16.9% | 11.8% |
| Standard Deviation (Population) | 16.7% | 11.7% |
Similar Demographics by Child Poverty Under the Age of 5
Demographics Similar to Immigrants from Ireland by Child Poverty Under the Age of 5
In terms of child poverty under the age of 5, the demographic groups most similar to Immigrants from Ireland are Immigrants from Japan (13.8%, a difference of 0.40%), Bolivian (13.8%, a difference of 0.70%), Immigrants from Bolivia (13.8%, a difference of 0.78%), Immigrants from China (13.6%, a difference of 0.88%), and Assyrian/Chaldean/Syriac (13.6%, a difference of 1.2%).
| Demographics | Rating | Rank | Child Poverty Under the Age of 5 |
| Immigrants | South Central Asia | 100.0 /100 | #12 | Exceptional 13.3% |
| Bhutanese | 100.0 /100 | #13 | Exceptional 13.4% |
| Okinawans | 100.0 /100 | #14 | Exceptional 13.4% |
| Indians (Asian) | 100.0 /100 | #15 | Exceptional 13.4% |
| Immigrants | Eastern Asia | 100.0 /100 | #16 | Exceptional 13.5% |
| Assyrians/Chaldeans/Syriacs | 100.0 /100 | #17 | Exceptional 13.6% |
| Immigrants | China | 100.0 /100 | #18 | Exceptional 13.6% |
| Immigrants | Ireland | 100.0 /100 | #19 | Exceptional 13.7% |
| Immigrants | Japan | 100.0 /100 | #20 | Exceptional 13.8% |
| Bolivians | 100.0 /100 | #21 | Exceptional 13.8% |
| Immigrants | Bolivia | 100.0 /100 | #22 | Exceptional 13.8% |
| Bulgarians | 99.9 /100 | #23 | Exceptional 13.9% |
| Asians | 99.9 /100 | #24 | Exceptional 14.0% |
| Cypriots | 99.9 /100 | #25 | Exceptional 14.0% |
| Immigrants | Lithuania | 99.9 /100 | #26 | Exceptional 14.1% |
Demographics Similar to Belizeans by Child Poverty Under the Age of 5
In terms of child poverty under the age of 5, the demographic groups most similar to Belizeans are Ottawa (20.3%, a difference of 0.0%), Immigrants from Burma/Myanmar (20.4%, a difference of 0.090%), Jamaican (20.4%, a difference of 0.16%), Aleut (20.3%, a difference of 0.40%), and Spanish American Indian (20.2%, a difference of 0.52%).
| Demographics | Rating | Rank | Child Poverty Under the Age of 5 |
| Immigrants | Bangladesh | 0.2 /100 | #261 | Tragic 20.1% |
| Liberians | 0.1 /100 | #262 | Tragic 20.2% |
| Barbadians | 0.1 /100 | #263 | Tragic 20.2% |
| Immigrants | Liberia | 0.1 /100 | #264 | Tragic 20.2% |
| Spanish American Indians | 0.1 /100 | #265 | Tragic 20.2% |
| Aleuts | 0.1 /100 | #266 | Tragic 20.3% |
| Ottawa | 0.1 /100 | #267 | Tragic 20.3% |
| Belizeans | 0.1 /100 | #268 | Tragic 20.3% |
| Immigrants | Burma/Myanmar | 0.1 /100 | #269 | Tragic 20.4% |
| Jamaicans | 0.1 /100 | #270 | Tragic 20.4% |
| Americans | 0.1 /100 | #271 | Tragic 20.5% |
| Immigrants | Jamaica | 0.1 /100 | #272 | Tragic 20.5% |
| Central Americans | 0.1 /100 | #273 | Tragic 20.6% |
| Immigrants | Belize | 0.1 /100 | #274 | Tragic 20.6% |
| Bangladeshis | 0.1 /100 | #275 | Tragic 20.6% |