Immigrants from Argentina vs Polish Poverty
COMPARE
Immigrants from Argentina
Polish
Poverty
Poverty Comparison
Immigrants from Argentina
Poles
11.7%
POVERTY
88.0/ 100
METRIC RATING
127th/ 347
METRIC RANK
10.7%
POVERTY
99.5/ 100
METRIC RATING
31st/ 347
METRIC RANK
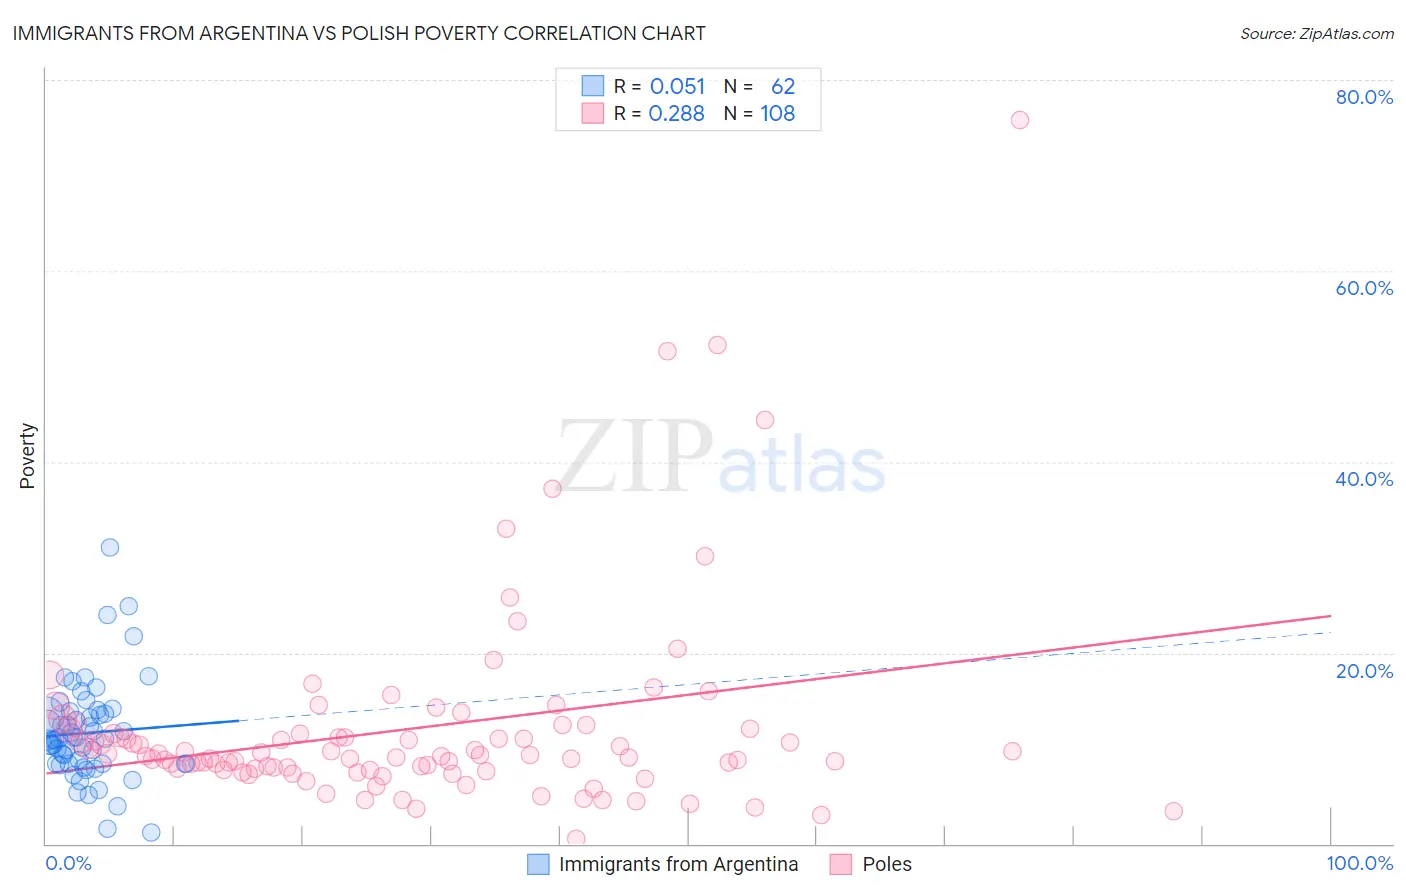
Immigrants from Argentina vs Polish Poverty Correlation Chart
The statistical analysis conducted on geographies consisting of 264,354,421 people shows a slight positive correlation between the proportion of Immigrants from Argentina and poverty level in the United States with a correlation coefficient (R) of 0.051 and weighted average of 11.7%. Similarly, the statistical analysis conducted on geographies consisting of 559,734,720 people shows a weak positive correlation between the proportion of Poles and poverty level in the United States with a correlation coefficient (R) of 0.288 and weighted average of 10.7%, a difference of 9.2%.
Poverty Correlation Summary
| Measurement | Immigrants from Argentina | Polish |
| Minimum | 1.2% | 0.55% |
| Maximum | 31.1% | 75.7% |
| Range | 29.9% | 75.2% |
| Mean | 11.6% | 12.1% |
| Median | 10.9% | 9.2% |
| Interquartile 25% (IQ1) | 8.3% | 7.8% |
| Interquartile 75% (IQ3) | 13.6% | 11.7% |
| Interquartile Range (IQR) | 5.2% | 3.9% |
| Standard Deviation (Sample) | 5.2% | 10.5% |
| Standard Deviation (Population) | 5.1% | 10.5% |
Similar Demographics by Poverty
Demographics Similar to Immigrants from Argentina by Poverty
In terms of poverty, the demographic groups most similar to Immigrants from Argentina are Immigrants from Norway (11.7%, a difference of 0.020%), Immigrants from Brazil (11.7%, a difference of 0.060%), Soviet Union (11.7%, a difference of 0.10%), Immigrants from Israel (11.7%, a difference of 0.13%), and Immigrants from Hungary (11.7%, a difference of 0.17%).
| Demographics | Rating | Rank | Poverty |
| Immigrants | South Eastern Asia | 88.9 /100 | #120 | Excellent 11.7% |
| New Zealanders | 88.7 /100 | #121 | Excellent 11.7% |
| Puget Sound Salish | 88.7 /100 | #122 | Excellent 11.7% |
| Immigrants | Hungary | 88.6 /100 | #123 | Excellent 11.7% |
| Soviet Union | 88.4 /100 | #124 | Excellent 11.7% |
| Immigrants | Brazil | 88.2 /100 | #125 | Excellent 11.7% |
| Immigrants | Norway | 88.0 /100 | #126 | Excellent 11.7% |
| Immigrants | Argentina | 88.0 /100 | #127 | Excellent 11.7% |
| Immigrants | Israel | 87.4 /100 | #128 | Excellent 11.7% |
| South Africans | 87.0 /100 | #129 | Excellent 11.7% |
| Immigrants | Ukraine | 86.6 /100 | #130 | Excellent 11.8% |
| French | 86.1 /100 | #131 | Excellent 11.8% |
| Peruvians | 85.6 /100 | #132 | Excellent 11.8% |
| Immigrants | Western Europe | 85.2 /100 | #133 | Excellent 11.8% |
| Yugoslavians | 85.2 /100 | #134 | Excellent 11.8% |
Demographics Similar to Poles by Poverty
In terms of poverty, the demographic groups most similar to Poles are Danish (10.7%, a difference of 0.080%), Greek (10.7%, a difference of 0.090%), Iranian (10.7%, a difference of 0.090%), Immigrants from Korea (10.7%, a difference of 0.19%), and Immigrants from Northern Europe (10.7%, a difference of 0.25%).
| Demographics | Rating | Rank | Poverty |
| Italians | 99.7 /100 | #24 | Exceptional 10.6% |
| Croatians | 99.6 /100 | #25 | Exceptional 10.6% |
| Burmese | 99.6 /100 | #26 | Exceptional 10.7% |
| Immigrants | Northern Europe | 99.6 /100 | #27 | Exceptional 10.7% |
| Immigrants | Korea | 99.5 /100 | #28 | Exceptional 10.7% |
| Greeks | 99.5 /100 | #29 | Exceptional 10.7% |
| Danes | 99.5 /100 | #30 | Exceptional 10.7% |
| Poles | 99.5 /100 | #31 | Exceptional 10.7% |
| Iranians | 99.5 /100 | #32 | Exceptional 10.7% |
| Macedonians | 99.4 /100 | #33 | Exceptional 10.8% |
| Immigrants | Poland | 99.4 /100 | #34 | Exceptional 10.8% |
| Tongans | 99.4 /100 | #35 | Exceptional 10.8% |
| Cypriots | 99.3 /100 | #36 | Exceptional 10.8% |
| Immigrants | Greece | 99.3 /100 | #37 | Exceptional 10.8% |
| Czechs | 99.3 /100 | #38 | Exceptional 10.8% |