Pennsylvania German vs Turkish Seniors Poverty Over the Age of 65
COMPARE
Pennsylvania German
Turkish
Seniors Poverty Over the Age of 65
Seniors Poverty Over the Age of 65 Comparison
Pennsylvania Germans
Turks
9.9%
SENIORS POVERTY OVER THE AGE OF 65
98.7/ 100
METRIC RATING
65th/ 347
METRIC RANK
10.0%
SENIORS POVERTY OVER THE AGE OF 65
97.9/ 100
METRIC RATING
74th/ 347
METRIC RANK
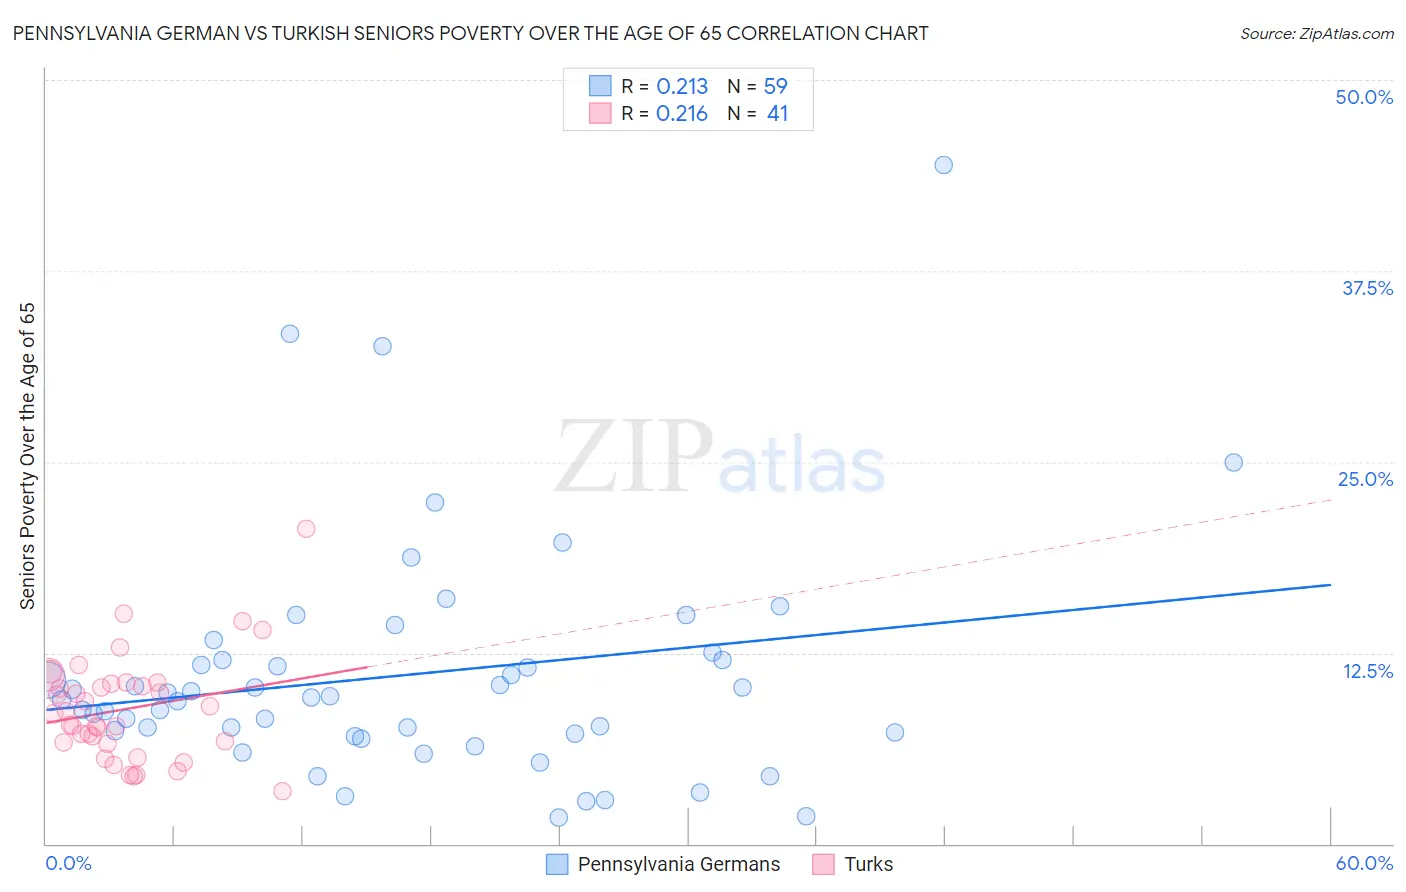
Pennsylvania German vs Turkish Seniors Poverty Over the Age of 65 Correlation Chart
The statistical analysis conducted on geographies consisting of 233,607,294 people shows a weak positive correlation between the proportion of Pennsylvania Germans and poverty level among seniors over the age of 65 in the United States with a correlation coefficient (R) of 0.213 and weighted average of 9.9%. Similarly, the statistical analysis conducted on geographies consisting of 271,163,307 people shows a weak positive correlation between the proportion of Turks and poverty level among seniors over the age of 65 in the United States with a correlation coefficient (R) of 0.216 and weighted average of 10.0%, a difference of 1.2%.
Seniors Poverty Over the Age of 65 Correlation Summary
| Measurement | Pennsylvania German | Turkish |
| Minimum | 1.7% | 3.5% |
| Maximum | 44.4% | 20.6% |
| Range | 42.7% | 17.1% |
| Mean | 11.1% | 8.8% |
| Median | 9.6% | 8.5% |
| Interquartile 25% (IQ1) | 7.2% | 6.6% |
| Interquartile 75% (IQ3) | 12.0% | 10.5% |
| Interquartile Range (IQR) | 4.9% | 3.9% |
| Standard Deviation (Sample) | 7.7% | 3.4% |
| Standard Deviation (Population) | 7.6% | 3.4% |
Demographics Similar to Pennsylvania Germans and Turks by Seniors Poverty Over the Age of 65
In terms of seniors poverty over the age of 65, the demographic groups most similar to Pennsylvania Germans are Immigrants from Netherlands (9.9%, a difference of 0.050%), Immigrants from Austria (9.9%, a difference of 0.15%), Immigrants from North America (9.9%, a difference of 0.28%), Macedonian (9.9%, a difference of 0.33%), and Canadian (9.9%, a difference of 0.37%). Similarly, the demographic groups most similar to Turks are Russian (10.0%, a difference of 0.020%), Palestinian (10.0%, a difference of 0.050%), Yugoslavian (10.0%, a difference of 0.070%), Immigrants from Czechoslovakia (10.0%, a difference of 0.090%), and Samoan (10.0%, a difference of 0.11%).
| Demographics | Rating | Rank | Seniors Poverty Over the Age of 65 |
| Immigrants | Canada | 99.0 /100 | #59 | Exceptional 9.8% |
| Celtics | 99.0 /100 | #60 | Exceptional 9.8% |
| Iranians | 98.9 /100 | #61 | Exceptional 9.8% |
| French Canadians | 98.9 /100 | #62 | Exceptional 9.8% |
| Macedonians | 98.8 /100 | #63 | Exceptional 9.9% |
| Immigrants | North America | 98.8 /100 | #64 | Exceptional 9.9% |
| Pennsylvania Germans | 98.7 /100 | #65 | Exceptional 9.9% |
| Immigrants | Netherlands | 98.7 /100 | #66 | Exceptional 9.9% |
| Immigrants | Austria | 98.6 /100 | #67 | Exceptional 9.9% |
| Canadians | 98.5 /100 | #68 | Exceptional 9.9% |
| Australians | 98.4 /100 | #69 | Exceptional 9.9% |
| Samoans | 98.0 /100 | #70 | Exceptional 10.0% |
| Yugoslavians | 97.9 /100 | #71 | Exceptional 10.0% |
| Palestinians | 97.9 /100 | #72 | Exceptional 10.0% |
| Russians | 97.9 /100 | #73 | Exceptional 10.0% |
| Turks | 97.9 /100 | #74 | Exceptional 10.0% |
| Immigrants | Czechoslovakia | 97.8 /100 | #75 | Exceptional 10.0% |
| New Zealanders | 97.7 /100 | #76 | Exceptional 10.0% |
| Immigrants | South Africa | 97.7 /100 | #77 | Exceptional 10.0% |
| Whites/Caucasians | 97.5 /100 | #78 | Exceptional 10.0% |
| Immigrants | Ireland | 97.5 /100 | #79 | Exceptional 10.0% |