French American Indian vs Turkish Seniors Poverty Over the Age of 65
COMPARE
French American Indian
Turkish
Seniors Poverty Over the Age of 65
Seniors Poverty Over the Age of 65 Comparison
French American Indians
Turks
11.5%
SENIORS POVERTY OVER THE AGE OF 65
8.7/ 100
METRIC RATING
215th/ 347
METRIC RANK
10.0%
SENIORS POVERTY OVER THE AGE OF 65
97.9/ 100
METRIC RATING
74th/ 347
METRIC RANK
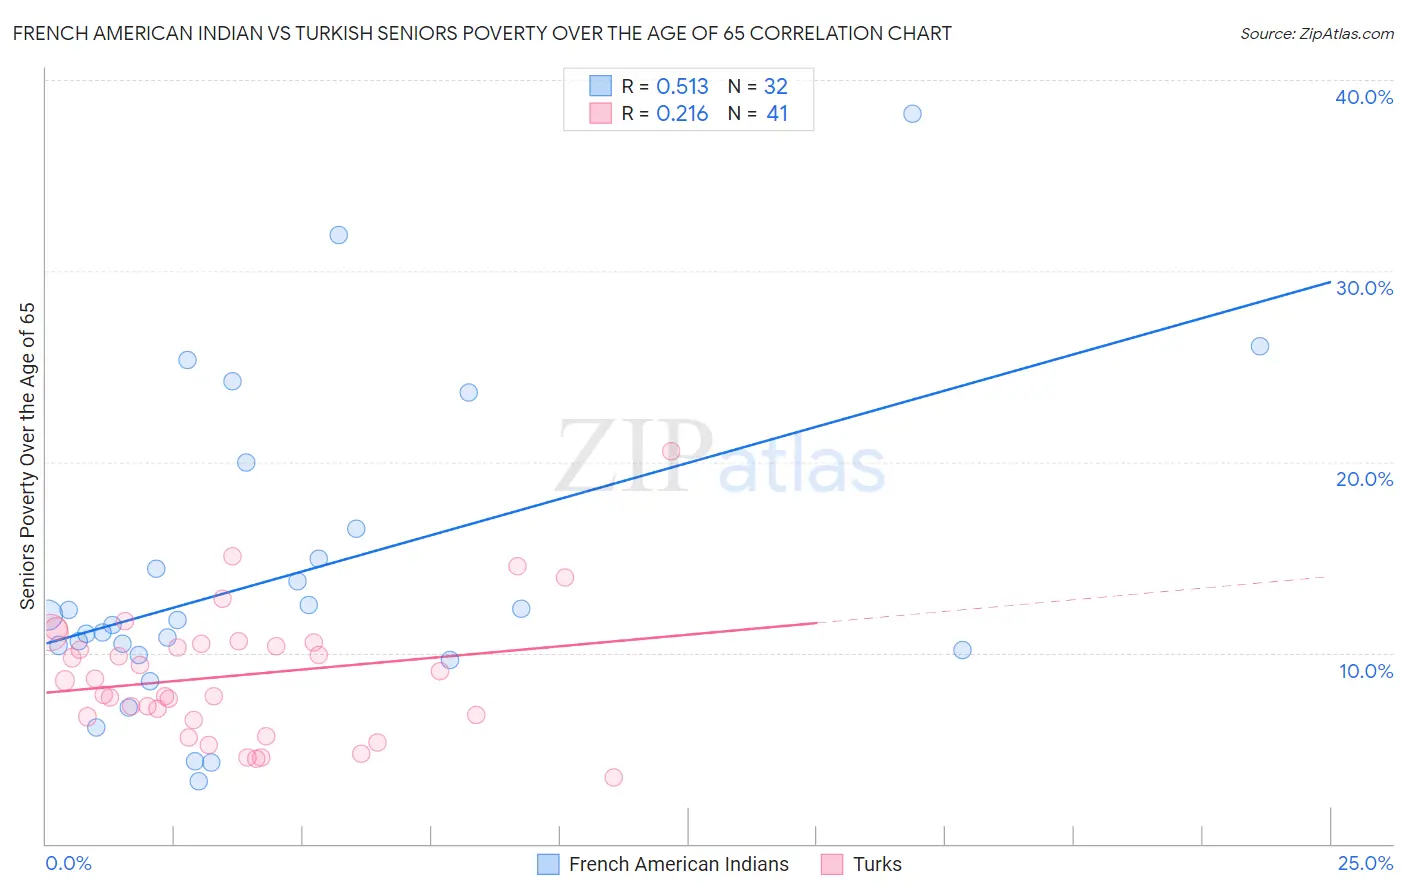
French American Indian vs Turkish Seniors Poverty Over the Age of 65 Correlation Chart
The statistical analysis conducted on geographies consisting of 131,882,711 people shows a substantial positive correlation between the proportion of French American Indians and poverty level among seniors over the age of 65 in the United States with a correlation coefficient (R) of 0.513 and weighted average of 11.5%. Similarly, the statistical analysis conducted on geographies consisting of 271,163,307 people shows a weak positive correlation between the proportion of Turks and poverty level among seniors over the age of 65 in the United States with a correlation coefficient (R) of 0.216 and weighted average of 10.0%, a difference of 15.0%.
Seniors Poverty Over the Age of 65 Correlation Summary
| Measurement | French American Indian | Turkish |
| Minimum | 3.3% | 3.5% |
| Maximum | 38.2% | 20.6% |
| Range | 35.0% | 17.1% |
| Mean | 14.0% | 8.8% |
| Median | 11.6% | 8.5% |
| Interquartile 25% (IQ1) | 10.0% | 6.6% |
| Interquartile 75% (IQ3) | 15.7% | 10.5% |
| Interquartile Range (IQR) | 5.7% | 3.9% |
| Standard Deviation (Sample) | 8.0% | 3.4% |
| Standard Deviation (Population) | 7.9% | 3.4% |
Similar Demographics by Seniors Poverty Over the Age of 65
Demographics Similar to French American Indians by Seniors Poverty Over the Age of 65
In terms of seniors poverty over the age of 65, the demographic groups most similar to French American Indians are Immigrants from Russia (11.5%, a difference of 0.040%), Nepalese (11.5%, a difference of 0.060%), Immigrants from China (11.5%, a difference of 0.22%), Indonesian (11.5%, a difference of 0.42%), and Immigrants from Morocco (11.6%, a difference of 0.55%).
| Demographics | Rating | Rank | Seniors Poverty Over the Age of 65 |
| South American Indians | 11.7 /100 | #208 | Poor 11.4% |
| Paraguayans | 11.3 /100 | #209 | Poor 11.4% |
| Ugandans | 11.2 /100 | #210 | Poor 11.4% |
| Indonesians | 10.4 /100 | #211 | Poor 11.5% |
| Immigrants | China | 9.5 /100 | #212 | Tragic 11.5% |
| Nepalese | 8.9 /100 | #213 | Tragic 11.5% |
| Immigrants | Russia | 8.8 /100 | #214 | Tragic 11.5% |
| French American Indians | 8.7 /100 | #215 | Tragic 11.5% |
| Immigrants | Morocco | 6.8 /100 | #216 | Tragic 11.6% |
| Immigrants | Africa | 6.4 /100 | #217 | Tragic 11.6% |
| Immigrants | Ukraine | 5.7 /100 | #218 | Tragic 11.6% |
| Arapaho | 5.2 /100 | #219 | Tragic 11.6% |
| Peruvians | 4.2 /100 | #220 | Tragic 11.7% |
| Argentineans | 4.1 /100 | #221 | Tragic 11.7% |
| Immigrants | Chile | 3.9 /100 | #222 | Tragic 11.7% |
Demographics Similar to Turks by Seniors Poverty Over the Age of 65
In terms of seniors poverty over the age of 65, the demographic groups most similar to Turks are Russian (10.0%, a difference of 0.020%), Palestinian (10.0%, a difference of 0.050%), Yugoslavian (10.0%, a difference of 0.070%), Immigrants from Czechoslovakia (10.0%, a difference of 0.090%), and Samoan (10.0%, a difference of 0.11%).
| Demographics | Rating | Rank | Seniors Poverty Over the Age of 65 |
| Immigrants | Austria | 98.6 /100 | #67 | Exceptional 9.9% |
| Canadians | 98.5 /100 | #68 | Exceptional 9.9% |
| Australians | 98.4 /100 | #69 | Exceptional 9.9% |
| Samoans | 98.0 /100 | #70 | Exceptional 10.0% |
| Yugoslavians | 97.9 /100 | #71 | Exceptional 10.0% |
| Palestinians | 97.9 /100 | #72 | Exceptional 10.0% |
| Russians | 97.9 /100 | #73 | Exceptional 10.0% |
| Turks | 97.9 /100 | #74 | Exceptional 10.0% |
| Immigrants | Czechoslovakia | 97.8 /100 | #75 | Exceptional 10.0% |
| New Zealanders | 97.7 /100 | #76 | Exceptional 10.0% |
| Immigrants | South Africa | 97.7 /100 | #77 | Exceptional 10.0% |
| Whites/Caucasians | 97.5 /100 | #78 | Exceptional 10.0% |
| Immigrants | Ireland | 97.5 /100 | #79 | Exceptional 10.0% |
| Koreans | 97.4 /100 | #80 | Exceptional 10.1% |
| Immigrants | Sri Lanka | 97.3 /100 | #81 | Exceptional 10.1% |