Tohono O'odham vs Somali Child Poverty Under the Age of 5
COMPARE
Tohono O'odham
Somali
Child Poverty Under the Age of 5
Child Poverty Under the Age of 5 Comparison
Tohono O'odham
Somalis
29.5%
CHILD POVERTY UNDER THE AGE OF 5
0.0/ 100
METRIC RATING
342nd/ 347
METRIC RANK
21.1%
CHILD POVERTY UNDER THE AGE OF 5
0.0/ 100
METRIC RATING
284th/ 347
METRIC RANK
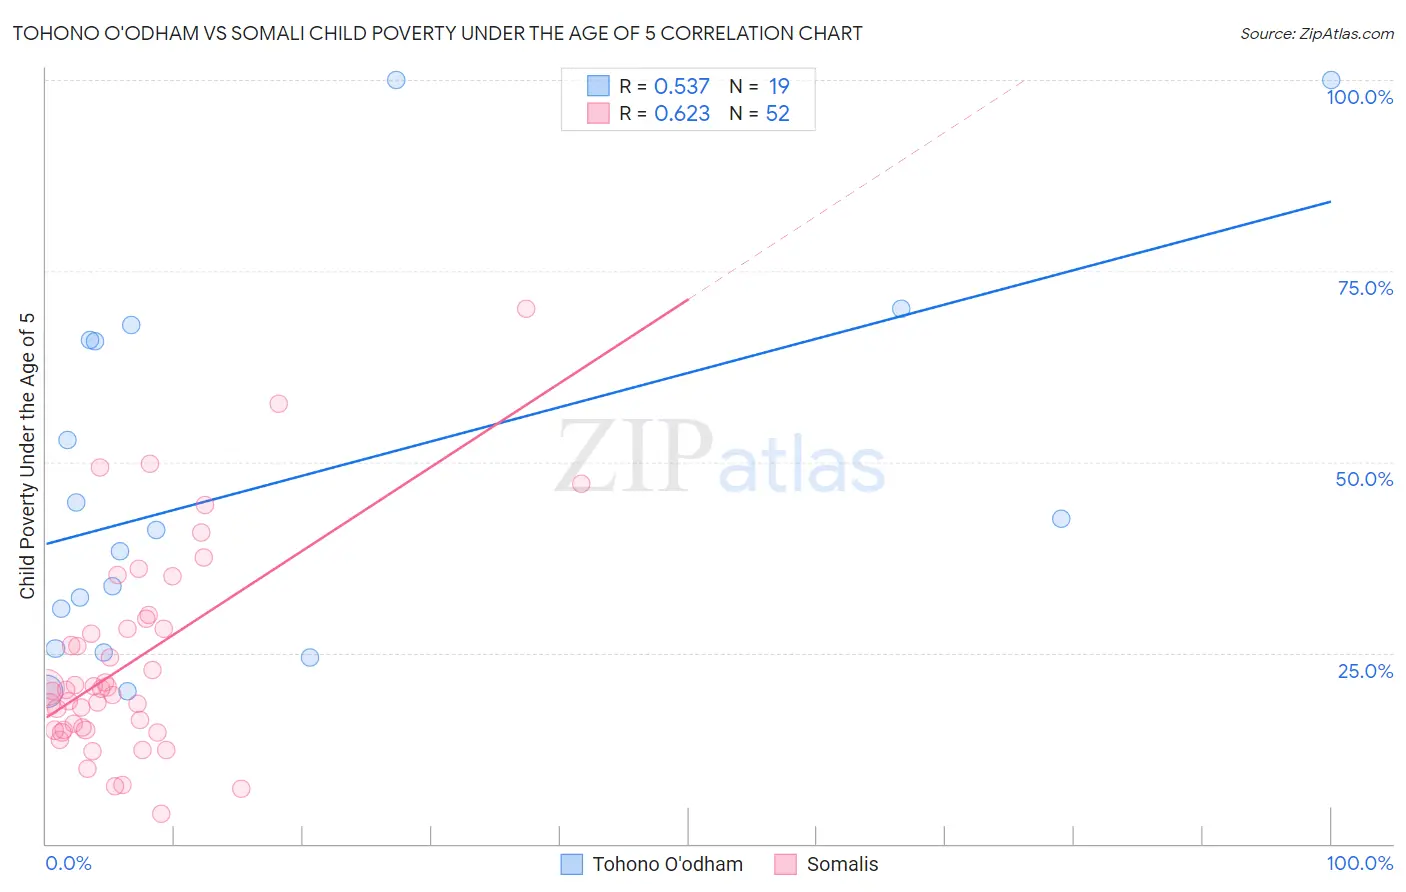
Tohono O'odham vs Somali Child Poverty Under the Age of 5 Correlation Chart
The statistical analysis conducted on geographies consisting of 58,528,457 people shows a substantial positive correlation between the proportion of Tohono O'odham and poverty level among children under the age of 5 in the United States with a correlation coefficient (R) of 0.537 and weighted average of 29.5%. Similarly, the statistical analysis conducted on geographies consisting of 98,642,642 people shows a significant positive correlation between the proportion of Somalis and poverty level among children under the age of 5 in the United States with a correlation coefficient (R) of 0.623 and weighted average of 21.1%, a difference of 39.7%.
Child Poverty Under the Age of 5 Correlation Summary
| Measurement | Tohono O'odham | Somali |
| Minimum | 19.9% | 3.9% |
| Maximum | 100.0% | 70.0% |
| Range | 80.1% | 66.1% |
| Mean | 47.4% | 23.9% |
| Median | 41.1% | 20.2% |
| Interquartile 25% (IQ1) | 25.5% | 14.9% |
| Interquartile 75% (IQ3) | 66.0% | 28.8% |
| Interquartile Range (IQR) | 40.4% | 13.9% |
| Standard Deviation (Sample) | 24.8% | 13.6% |
| Standard Deviation (Population) | 24.1% | 13.4% |
Similar Demographics by Child Poverty Under the Age of 5
Demographics Similar to Tohono O'odham by Child Poverty Under the Age of 5
In terms of child poverty under the age of 5, the demographic groups most similar to Tohono O'odham are Yuman (29.5%, a difference of 0.16%), Immigrants from Yemen (29.3%, a difference of 0.68%), Cheyenne (28.3%, a difference of 4.1%), Crow (31.0%, a difference of 5.1%), and Yup'ik (27.7%, a difference of 6.4%).
| Demographics | Rating | Rank | Child Poverty Under the Age of 5 |
| Natives/Alaskans | 0.0 /100 | #333 | Tragic 25.6% |
| Blacks/African Americans | 0.0 /100 | #334 | Tragic 25.7% |
| Colville | 0.0 /100 | #335 | Tragic 25.7% |
| Sioux | 0.0 /100 | #336 | Tragic 26.9% |
| Pima | 0.0 /100 | #337 | Tragic 27.4% |
| Hopi | 0.0 /100 | #338 | Tragic 27.7% |
| Yup'ik | 0.0 /100 | #339 | Tragic 27.7% |
| Cheyenne | 0.0 /100 | #340 | Tragic 28.3% |
| Immigrants | Yemen | 0.0 /100 | #341 | Tragic 29.3% |
| Tohono O'odham | 0.0 /100 | #342 | Tragic 29.5% |
| Yuman | 0.0 /100 | #343 | Tragic 29.5% |
| Crow | 0.0 /100 | #344 | Tragic 31.0% |
| Navajo | 0.0 /100 | #345 | Tragic 31.6% |
| Lumbee | 0.0 /100 | #346 | Tragic 33.3% |
| Puerto Ricans | 0.0 /100 | #347 | Tragic 34.5% |
Demographics Similar to Somalis by Child Poverty Under the Age of 5
In terms of child poverty under the age of 5, the demographic groups most similar to Somalis are Comanche (21.0%, a difference of 0.33%), Haitian (21.2%, a difference of 0.47%), Potawatomi (21.0%, a difference of 0.53%), Immigrants from Latin America (21.2%, a difference of 0.55%), and Immigrants from Zaire (21.3%, a difference of 0.64%).
| Demographics | Rating | Rank | Child Poverty Under the Age of 5 |
| Immigrants | West Indies | 0.0 /100 | #277 | Tragic 20.7% |
| Immigrants | Grenada | 0.0 /100 | #278 | Tragic 20.7% |
| Sub-Saharan Africans | 0.0 /100 | #279 | Tragic 20.8% |
| French American Indians | 0.0 /100 | #280 | Tragic 20.8% |
| Senegalese | 0.0 /100 | #281 | Tragic 20.9% |
| Potawatomi | 0.0 /100 | #282 | Tragic 21.0% |
| Comanche | 0.0 /100 | #283 | Tragic 21.0% |
| Somalis | 0.0 /100 | #284 | Tragic 21.1% |
| Haitians | 0.0 /100 | #285 | Tragic 21.2% |
| Immigrants | Latin America | 0.0 /100 | #286 | Tragic 21.2% |
| Immigrants | Zaire | 0.0 /100 | #287 | Tragic 21.3% |
| Immigrants | Senegal | 0.0 /100 | #288 | Tragic 21.3% |
| Immigrants | Haiti | 0.0 /100 | #289 | Tragic 21.3% |
| Immigrants | Caribbean | 0.0 /100 | #290 | Tragic 21.4% |
| British West Indians | 0.0 /100 | #291 | Tragic 21.4% |