Immigrants from Jordan vs Somali Child Poverty Under the Age of 5
COMPARE
Immigrants from Jordan
Somali
Child Poverty Under the Age of 5
Child Poverty Under the Age of 5 Comparison
Immigrants from Jordan
Somalis
16.1%
CHILD POVERTY UNDER THE AGE OF 5
93.2/ 100
METRIC RATING
119th/ 347
METRIC RANK
21.1%
CHILD POVERTY UNDER THE AGE OF 5
0.0/ 100
METRIC RATING
284th/ 347
METRIC RANK
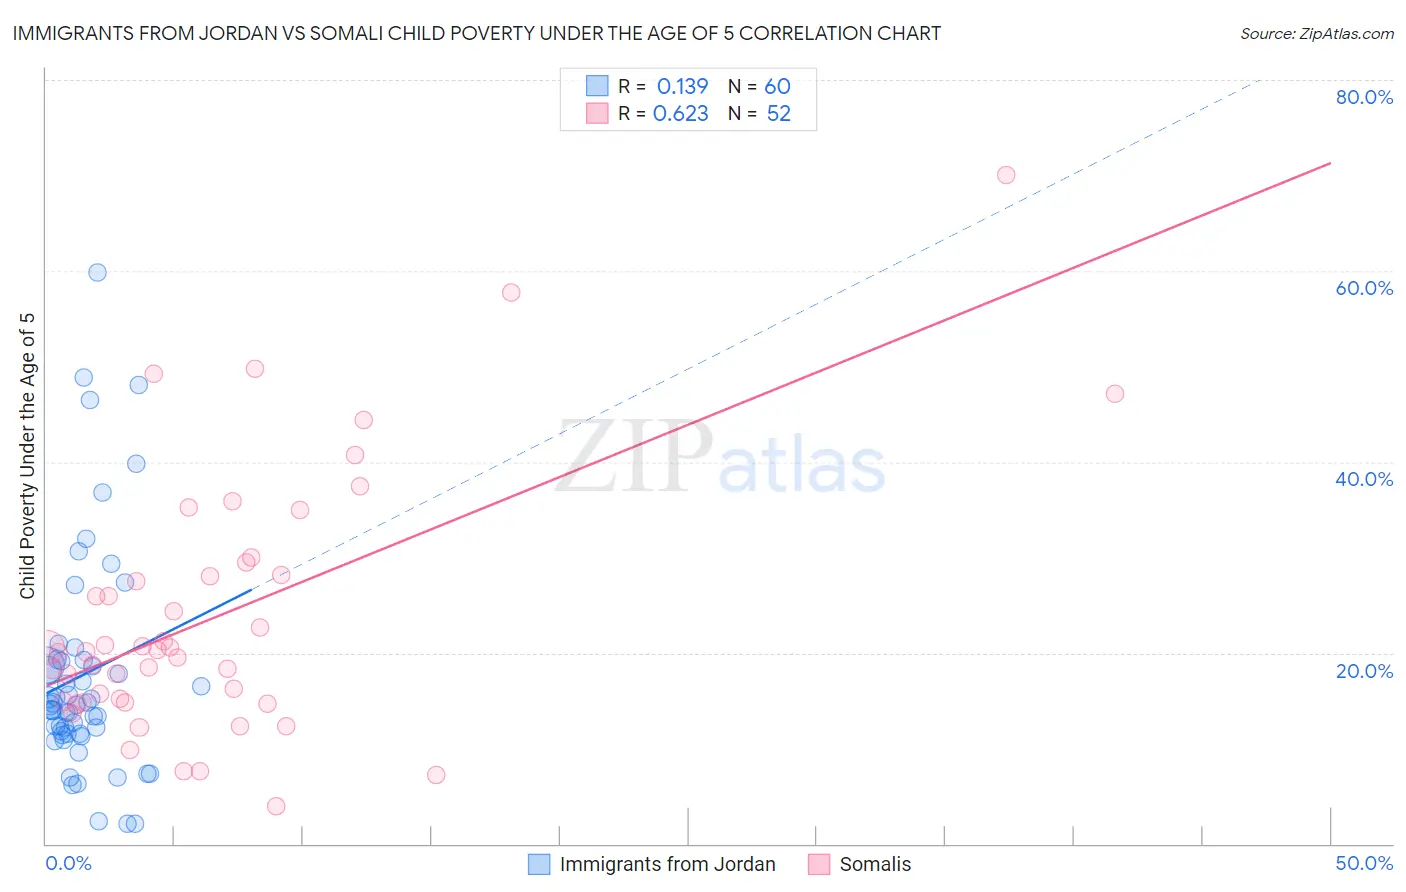
Immigrants from Jordan vs Somali Child Poverty Under the Age of 5 Correlation Chart
The statistical analysis conducted on geographies consisting of 178,163,363 people shows a poor positive correlation between the proportion of Immigrants from Jordan and poverty level among children under the age of 5 in the United States with a correlation coefficient (R) of 0.139 and weighted average of 16.1%. Similarly, the statistical analysis conducted on geographies consisting of 98,642,642 people shows a significant positive correlation between the proportion of Somalis and poverty level among children under the age of 5 in the United States with a correlation coefficient (R) of 0.623 and weighted average of 21.1%, a difference of 31.5%.
Child Poverty Under the Age of 5 Correlation Summary
| Measurement | Immigrants from Jordan | Somali |
| Minimum | 2.1% | 3.9% |
| Maximum | 59.8% | 70.0% |
| Range | 57.7% | 66.1% |
| Mean | 17.7% | 23.9% |
| Median | 14.5% | 20.2% |
| Interquartile 25% (IQ1) | 11.6% | 14.9% |
| Interquartile 75% (IQ3) | 19.2% | 28.8% |
| Interquartile Range (IQR) | 7.6% | 13.9% |
| Standard Deviation (Sample) | 11.8% | 13.6% |
| Standard Deviation (Population) | 11.7% | 13.4% |
Similar Demographics by Child Poverty Under the Age of 5
Demographics Similar to Immigrants from Jordan by Child Poverty Under the Age of 5
In terms of child poverty under the age of 5, the demographic groups most similar to Immigrants from Jordan are Basque (16.0%, a difference of 0.11%), Immigrants from Denmark (16.0%, a difference of 0.11%), Immigrants from Austria (16.0%, a difference of 0.13%), Immigrants from Peru (16.1%, a difference of 0.26%), and Mongolian (16.1%, a difference of 0.27%).
| Demographics | Rating | Rank | Child Poverty Under the Age of 5 |
| Peruvians | 94.1 /100 | #112 | Exceptional 16.0% |
| Puget Sound Salish | 94.1 /100 | #113 | Exceptional 16.0% |
| Immigrants | Kuwait | 93.9 /100 | #114 | Exceptional 16.0% |
| Albanians | 93.8 /100 | #115 | Exceptional 16.0% |
| Immigrants | Austria | 93.5 /100 | #116 | Exceptional 16.0% |
| Basques | 93.4 /100 | #117 | Exceptional 16.0% |
| Immigrants | Denmark | 93.4 /100 | #118 | Exceptional 16.0% |
| Immigrants | Jordan | 93.2 /100 | #119 | Exceptional 16.1% |
| Immigrants | Peru | 92.6 /100 | #120 | Exceptional 16.1% |
| Mongolians | 92.5 /100 | #121 | Exceptional 16.1% |
| Immigrants | Southern Europe | 92.0 /100 | #122 | Exceptional 16.1% |
| Austrians | 92.0 /100 | #123 | Exceptional 16.1% |
| Swiss | 92.0 /100 | #124 | Exceptional 16.1% |
| Native Hawaiians | 91.8 /100 | #125 | Exceptional 16.2% |
| Immigrants | Albania | 91.8 /100 | #126 | Exceptional 16.2% |
Demographics Similar to Somalis by Child Poverty Under the Age of 5
In terms of child poverty under the age of 5, the demographic groups most similar to Somalis are Comanche (21.0%, a difference of 0.33%), Haitian (21.2%, a difference of 0.47%), Potawatomi (21.0%, a difference of 0.53%), Immigrants from Latin America (21.2%, a difference of 0.55%), and Immigrants from Zaire (21.3%, a difference of 0.64%).
| Demographics | Rating | Rank | Child Poverty Under the Age of 5 |
| Immigrants | West Indies | 0.0 /100 | #277 | Tragic 20.7% |
| Immigrants | Grenada | 0.0 /100 | #278 | Tragic 20.7% |
| Sub-Saharan Africans | 0.0 /100 | #279 | Tragic 20.8% |
| French American Indians | 0.0 /100 | #280 | Tragic 20.8% |
| Senegalese | 0.0 /100 | #281 | Tragic 20.9% |
| Potawatomi | 0.0 /100 | #282 | Tragic 21.0% |
| Comanche | 0.0 /100 | #283 | Tragic 21.0% |
| Somalis | 0.0 /100 | #284 | Tragic 21.1% |
| Haitians | 0.0 /100 | #285 | Tragic 21.2% |
| Immigrants | Latin America | 0.0 /100 | #286 | Tragic 21.2% |
| Immigrants | Zaire | 0.0 /100 | #287 | Tragic 21.3% |
| Immigrants | Senegal | 0.0 /100 | #288 | Tragic 21.3% |
| Immigrants | Haiti | 0.0 /100 | #289 | Tragic 21.3% |
| Immigrants | Caribbean | 0.0 /100 | #290 | Tragic 21.4% |
| British West Indians | 0.0 /100 | #291 | Tragic 21.4% |