Immigrants from Latvia vs Somali Child Poverty Under the Age of 5
COMPARE
Immigrants from Latvia
Somali
Child Poverty Under the Age of 5
Child Poverty Under the Age of 5 Comparison
Immigrants from Latvia
Somalis
15.6%
CHILD POVERTY UNDER THE AGE OF 5
97.4/ 100
METRIC RATING
85th/ 347
METRIC RANK
21.1%
CHILD POVERTY UNDER THE AGE OF 5
0.0/ 100
METRIC RATING
284th/ 347
METRIC RANK
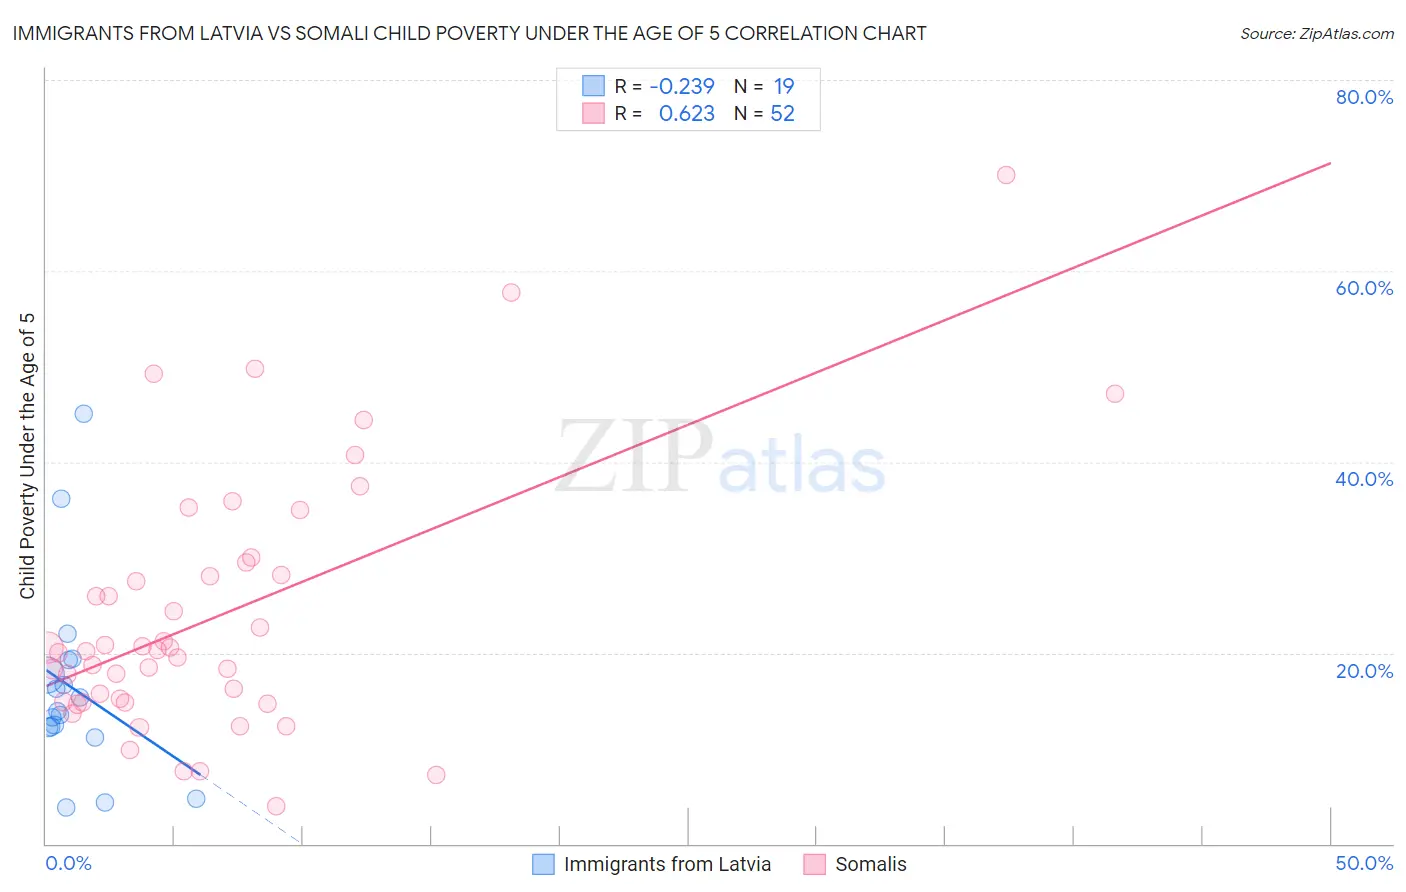
Immigrants from Latvia vs Somali Child Poverty Under the Age of 5 Correlation Chart
The statistical analysis conducted on geographies consisting of 111,248,278 people shows a weak negative correlation between the proportion of Immigrants from Latvia and poverty level among children under the age of 5 in the United States with a correlation coefficient (R) of -0.239 and weighted average of 15.6%. Similarly, the statistical analysis conducted on geographies consisting of 98,642,642 people shows a significant positive correlation between the proportion of Somalis and poverty level among children under the age of 5 in the United States with a correlation coefficient (R) of 0.623 and weighted average of 21.1%, a difference of 35.3%.
Child Poverty Under the Age of 5 Correlation Summary
| Measurement | Immigrants from Latvia | Somali |
| Minimum | 3.8% | 3.9% |
| Maximum | 45.0% | 70.0% |
| Range | 41.2% | 66.1% |
| Mean | 16.3% | 23.9% |
| Median | 13.8% | 20.2% |
| Interquartile 25% (IQ1) | 12.2% | 14.9% |
| Interquartile 75% (IQ3) | 19.3% | 28.8% |
| Interquartile Range (IQR) | 7.1% | 13.9% |
| Standard Deviation (Sample) | 10.0% | 13.6% |
| Standard Deviation (Population) | 9.7% | 13.4% |
Similar Demographics by Child Poverty Under the Age of 5
Demographics Similar to Immigrants from Latvia by Child Poverty Under the Age of 5
In terms of child poverty under the age of 5, the demographic groups most similar to Immigrants from Latvia are Immigrants from Malaysia (15.6%, a difference of 0.0%), Immigrants from Vietnam (15.6%, a difference of 0.080%), Jordanian (15.6%, a difference of 0.14%), Immigrants from Netherlands (15.6%, a difference of 0.16%), and Chilean (15.6%, a difference of 0.18%).
| Demographics | Rating | Rank | Child Poverty Under the Age of 5 |
| Sri Lankans | 98.1 /100 | #78 | Exceptional 15.5% |
| Australians | 98.0 /100 | #79 | Exceptional 15.5% |
| Italians | 97.9 /100 | #80 | Exceptional 15.5% |
| Czechs | 97.8 /100 | #81 | Exceptional 15.5% |
| Immigrants | Italy | 97.7 /100 | #82 | Exceptional 15.6% |
| Chileans | 97.6 /100 | #83 | Exceptional 15.6% |
| Immigrants | Netherlands | 97.6 /100 | #84 | Exceptional 15.6% |
| Immigrants | Latvia | 97.4 /100 | #85 | Exceptional 15.6% |
| Immigrants | Malaysia | 97.4 /100 | #86 | Exceptional 15.6% |
| Immigrants | Vietnam | 97.4 /100 | #87 | Exceptional 15.6% |
| Jordanians | 97.3 /100 | #88 | Exceptional 15.6% |
| Immigrants | Croatia | 97.3 /100 | #89 | Exceptional 15.6% |
| Immigrants | France | 97.3 /100 | #90 | Exceptional 15.6% |
| Poles | 97.2 /100 | #91 | Exceptional 15.7% |
| Scandinavians | 97.1 /100 | #92 | Exceptional 15.7% |
Demographics Similar to Somalis by Child Poverty Under the Age of 5
In terms of child poverty under the age of 5, the demographic groups most similar to Somalis are Comanche (21.0%, a difference of 0.33%), Haitian (21.2%, a difference of 0.47%), Potawatomi (21.0%, a difference of 0.53%), Immigrants from Latin America (21.2%, a difference of 0.55%), and Immigrants from Zaire (21.3%, a difference of 0.64%).
| Demographics | Rating | Rank | Child Poverty Under the Age of 5 |
| Immigrants | West Indies | 0.0 /100 | #277 | Tragic 20.7% |
| Immigrants | Grenada | 0.0 /100 | #278 | Tragic 20.7% |
| Sub-Saharan Africans | 0.0 /100 | #279 | Tragic 20.8% |
| French American Indians | 0.0 /100 | #280 | Tragic 20.8% |
| Senegalese | 0.0 /100 | #281 | Tragic 20.9% |
| Potawatomi | 0.0 /100 | #282 | Tragic 21.0% |
| Comanche | 0.0 /100 | #283 | Tragic 21.0% |
| Somalis | 0.0 /100 | #284 | Tragic 21.1% |
| Haitians | 0.0 /100 | #285 | Tragic 21.2% |
| Immigrants | Latin America | 0.0 /100 | #286 | Tragic 21.2% |
| Immigrants | Zaire | 0.0 /100 | #287 | Tragic 21.3% |
| Immigrants | Senegal | 0.0 /100 | #288 | Tragic 21.3% |
| Immigrants | Haiti | 0.0 /100 | #289 | Tragic 21.3% |
| Immigrants | Caribbean | 0.0 /100 | #290 | Tragic 21.4% |
| British West Indians | 0.0 /100 | #291 | Tragic 21.4% |