Peruvian vs Ethiopian Female Poverty Among 25-34 Year Olds
COMPARE
Peruvian
Ethiopian
Female Poverty Among 25-34 Year Olds
Female Poverty Among 25-34 Year Olds Comparison
Peruvians
Ethiopians
12.7%
FEMALE POVERTY AMONG 25-34 YEAR OLDS
95.6/ 100
METRIC RATING
102nd/ 347
METRIC RANK
12.4%
FEMALE POVERTY AMONG 25-34 YEAR OLDS
98.0/ 100
METRIC RATING
82nd/ 347
METRIC RANK
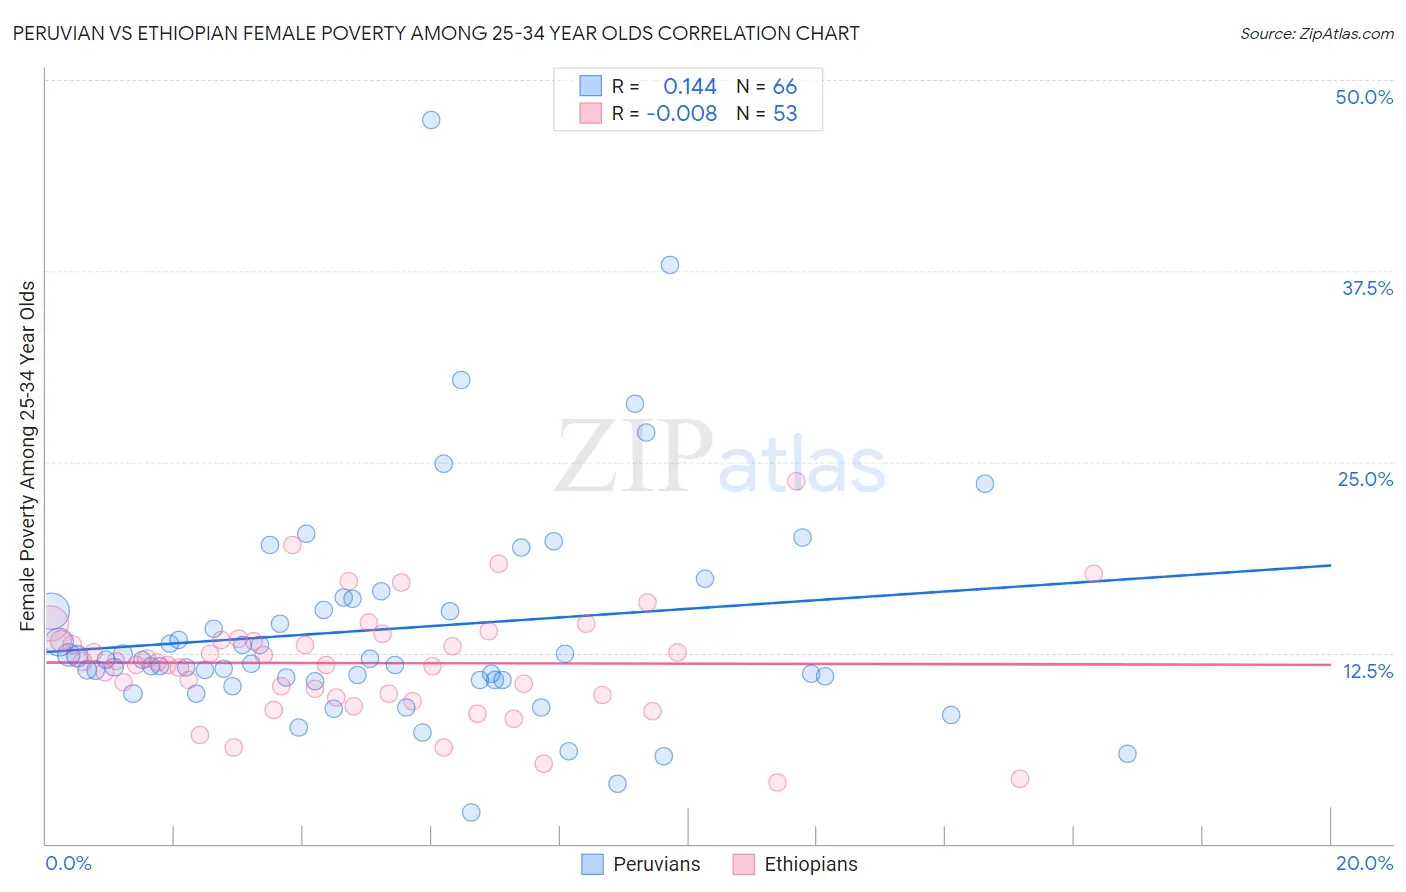
Peruvian vs Ethiopian Female Poverty Among 25-34 Year Olds Correlation Chart
The statistical analysis conducted on geographies consisting of 358,420,954 people shows a poor positive correlation between the proportion of Peruvians and poverty level among females between the ages 25 and 34 in the United States with a correlation coefficient (R) of 0.144 and weighted average of 12.7%. Similarly, the statistical analysis conducted on geographies consisting of 221,750,930 people shows no correlation between the proportion of Ethiopians and poverty level among females between the ages 25 and 34 in the United States with a correlation coefficient (R) of -0.008 and weighted average of 12.4%, a difference of 1.9%.
Female Poverty Among 25-34 Year Olds Correlation Summary
| Measurement | Peruvian | Ethiopian |
| Minimum | 2.0% | 4.0% |
| Maximum | 47.4% | 23.7% |
| Range | 45.3% | 19.7% |
| Mean | 14.1% | 11.8% |
| Median | 11.9% | 11.9% |
| Interquartile 25% (IQ1) | 10.7% | 9.7% |
| Interquartile 75% (IQ3) | 15.3% | 13.4% |
| Interquartile Range (IQR) | 4.6% | 3.7% |
| Standard Deviation (Sample) | 7.4% | 3.7% |
| Standard Deviation (Population) | 7.4% | 3.7% |
Demographics Similar to Peruvians and Ethiopians by Female Poverty Among 25-34 Year Olds
In terms of female poverty among 25-34 year olds, the demographic groups most similar to Peruvians are Immigrants from Switzerland (12.7%, a difference of 0.060%), Immigrants from Denmark (12.7%, a difference of 0.080%), Immigrants from Argentina (12.6%, a difference of 0.46%), Immigrants from Northern Africa (12.6%, a difference of 0.58%), and Immigrants from Ethiopia (12.6%, a difference of 0.58%). Similarly, the demographic groups most similar to Ethiopians are Albanian (12.5%, a difference of 0.32%), Immigrants from Latvia (12.5%, a difference of 0.38%), Immigrants from South Eastern Asia (12.5%, a difference of 0.49%), Croatian (12.5%, a difference of 0.50%), and Argentinean (12.5%, a difference of 0.53%).
| Demographics | Rating | Rank | Female Poverty Among 25-34 Year Olds |
| Ethiopians | 98.0 /100 | #82 | Exceptional 12.4% |
| Albanians | 97.7 /100 | #83 | Exceptional 12.5% |
| Immigrants | Latvia | 97.7 /100 | #84 | Exceptional 12.5% |
| Immigrants | South Eastern Asia | 97.6 /100 | #85 | Exceptional 12.5% |
| Croatians | 97.5 /100 | #86 | Exceptional 12.5% |
| Argentineans | 97.5 /100 | #87 | Exceptional 12.5% |
| Immigrants | Austria | 97.4 /100 | #88 | Exceptional 12.5% |
| Italians | 97.2 /100 | #89 | Exceptional 12.5% |
| Immigrants | Albania | 97.1 /100 | #90 | Exceptional 12.5% |
| Norwegians | 96.9 /100 | #91 | Exceptional 12.6% |
| Immigrants | Armenia | 96.9 /100 | #92 | Exceptional 12.6% |
| Palestinians | 96.9 /100 | #93 | Exceptional 12.6% |
| Immigrants | France | 96.8 /100 | #94 | Exceptional 12.6% |
| Ukrainians | 96.7 /100 | #95 | Exceptional 12.6% |
| Immigrants | Zimbabwe | 96.7 /100 | #96 | Exceptional 12.6% |
| Immigrants | Northern Africa | 96.6 /100 | #97 | Exceptional 12.6% |
| Immigrants | Ethiopia | 96.5 /100 | #98 | Exceptional 12.6% |
| Immigrants | Argentina | 96.4 /100 | #99 | Exceptional 12.6% |
| Immigrants | Denmark | 95.7 /100 | #100 | Exceptional 12.7% |
| Immigrants | Switzerland | 95.7 /100 | #101 | Exceptional 12.7% |
| Peruvians | 95.6 /100 | #102 | Exceptional 12.7% |