Laotian vs Yaqui Single Female Poverty
COMPARE
Laotian
Yaqui
Single Female Poverty
Single Female Poverty Comparison
Laotians
Yaqui
19.3%
SINGLE FEMALE POVERTY
99.5/ 100
METRIC RATING
68th/ 347
METRIC RANK
24.9%
SINGLE FEMALE POVERTY
0.0/ 100
METRIC RATING
298th/ 347
METRIC RANK
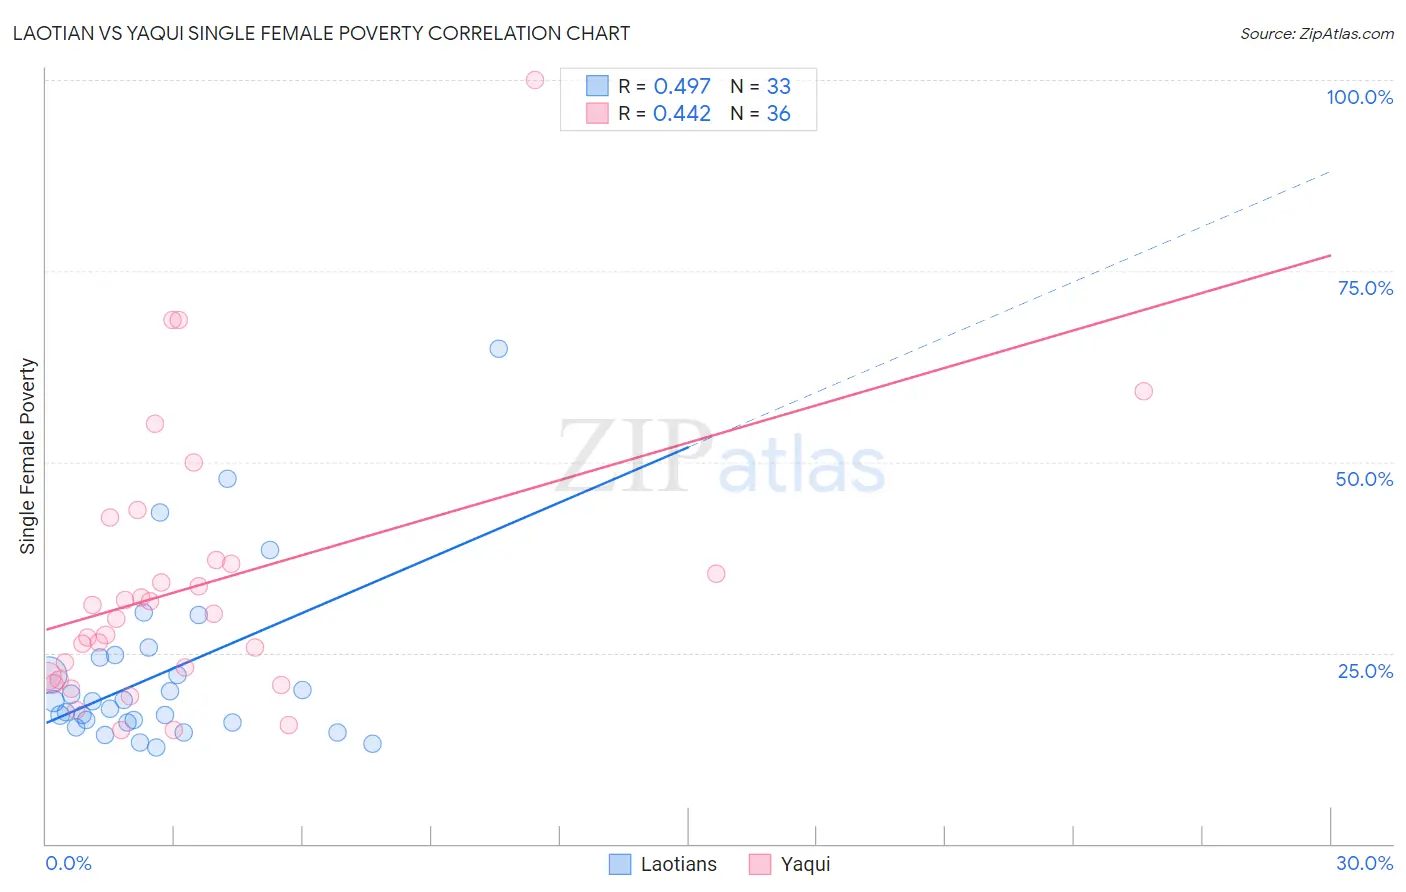
Laotian vs Yaqui Single Female Poverty Correlation Chart
The statistical analysis conducted on geographies consisting of 222,876,805 people shows a moderate positive correlation between the proportion of Laotians and poverty level among single females in the United States with a correlation coefficient (R) of 0.497 and weighted average of 19.3%. Similarly, the statistical analysis conducted on geographies consisting of 107,224,239 people shows a moderate positive correlation between the proportion of Yaqui and poverty level among single females in the United States with a correlation coefficient (R) of 0.442 and weighted average of 24.9%, a difference of 29.2%.
Single Female Poverty Correlation Summary
| Measurement | Laotian | Yaqui |
| Minimum | 12.6% | 14.9% |
| Maximum | 64.9% | 100.0% |
| Range | 52.3% | 85.1% |
| Mean | 22.3% | 33.8% |
| Median | 18.7% | 29.7% |
| Interquartile 25% (IQ1) | 15.9% | 21.7% |
| Interquartile 75% (IQ3) | 24.6% | 37.0% |
| Interquartile Range (IQR) | 8.7% | 15.3% |
| Standard Deviation (Sample) | 11.4% | 17.9% |
| Standard Deviation (Population) | 11.2% | 17.7% |
Similar Demographics by Single Female Poverty
Demographics Similar to Laotians by Single Female Poverty
In terms of single female poverty, the demographic groups most similar to Laotians are Immigrants from Egypt (19.2%, a difference of 0.040%), Palestinian (19.2%, a difference of 0.080%), Cypriot (19.2%, a difference of 0.10%), Immigrants from Europe (19.2%, a difference of 0.12%), and Immigrants from Northern Europe (19.2%, a difference of 0.13%).
| Demographics | Rating | Rank | Single Female Poverty |
| Cambodians | 99.6 /100 | #61 | Exceptional 19.2% |
| Lithuanians | 99.6 /100 | #62 | Exceptional 19.2% |
| Immigrants | Northern Europe | 99.6 /100 | #63 | Exceptional 19.2% |
| Immigrants | Europe | 99.6 /100 | #64 | Exceptional 19.2% |
| Cypriots | 99.6 /100 | #65 | Exceptional 19.2% |
| Palestinians | 99.6 /100 | #66 | Exceptional 19.2% |
| Immigrants | Egypt | 99.6 /100 | #67 | Exceptional 19.2% |
| Laotians | 99.5 /100 | #68 | Exceptional 19.3% |
| Paraguayans | 99.5 /100 | #69 | Exceptional 19.3% |
| Immigrants | Jordan | 99.4 /100 | #70 | Exceptional 19.3% |
| Immigrants | South Eastern Asia | 99.4 /100 | #71 | Exceptional 19.3% |
| Immigrants | Latvia | 99.4 /100 | #72 | Exceptional 19.3% |
| Immigrants | Peru | 99.4 /100 | #73 | Exceptional 19.3% |
| Immigrants | Belarus | 99.4 /100 | #74 | Exceptional 19.3% |
| Immigrants | Turkey | 99.4 /100 | #75 | Exceptional 19.4% |
Demographics Similar to Yaqui by Single Female Poverty
In terms of single female poverty, the demographic groups most similar to Yaqui are Immigrants from Central America (24.8%, a difference of 0.19%), African (24.8%, a difference of 0.48%), Mexican (25.0%, a difference of 0.67%), Blackfeet (25.1%, a difference of 0.74%), and Honduran (25.1%, a difference of 0.92%).
| Demographics | Rating | Rank | Single Female Poverty |
| Osage | 0.0 /100 | #291 | Tragic 24.4% |
| Alsatians | 0.0 /100 | #292 | Tragic 24.5% |
| Americans | 0.0 /100 | #293 | Tragic 24.5% |
| French American Indians | 0.0 /100 | #294 | Tragic 24.6% |
| Hispanics or Latinos | 0.0 /100 | #295 | Tragic 24.6% |
| Africans | 0.0 /100 | #296 | Tragic 24.8% |
| Immigrants | Central America | 0.0 /100 | #297 | Tragic 24.8% |
| Yaqui | 0.0 /100 | #298 | Tragic 24.9% |
| Mexicans | 0.0 /100 | #299 | Tragic 25.0% |
| Blackfeet | 0.0 /100 | #300 | Tragic 25.1% |
| Hondurans | 0.0 /100 | #301 | Tragic 25.1% |
| Shoshone | 0.0 /100 | #302 | Tragic 25.1% |
| Somalis | 0.0 /100 | #303 | Tragic 25.2% |
| Immigrants | Congo | 0.0 /100 | #304 | Tragic 25.3% |
| Immigrants | Dominican Republic | 0.0 /100 | #305 | Tragic 25.3% |