Immigrants from Singapore vs Ute Female Poverty Among 18-24 Year Olds
COMPARE
Immigrants from Singapore
Ute
Female Poverty Among 18-24 Year Olds
Female Poverty Among 18-24 Year Olds Comparison
Immigrants from Singapore
Ute
20.9%
FEMALE POVERTY AMONG 18-24 YEAR OLDS
4.4/ 100
METRIC RATING
238th/ 347
METRIC RANK
25.4%
FEMALE POVERTY AMONG 18-24 YEAR OLDS
0.0/ 100
METRIC RATING
327th/ 347
METRIC RANK
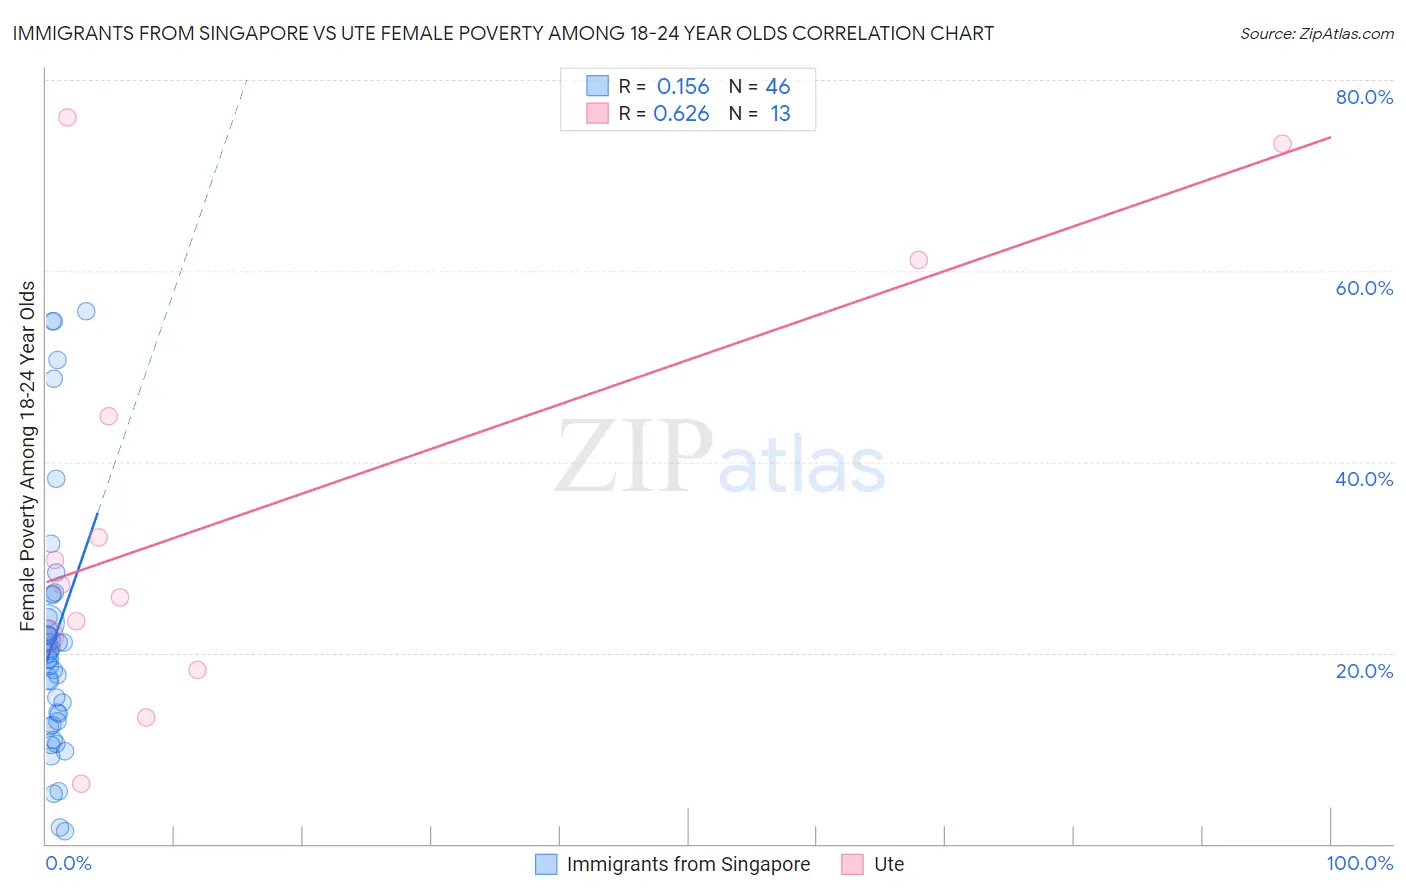
Immigrants from Singapore vs Ute Female Poverty Among 18-24 Year Olds Correlation Chart
The statistical analysis conducted on geographies consisting of 136,205,115 people shows a poor positive correlation between the proportion of Immigrants from Singapore and poverty level among females between the ages 18 and 24 in the United States with a correlation coefficient (R) of 0.156 and weighted average of 20.9%. Similarly, the statistical analysis conducted on geographies consisting of 55,446,169 people shows a significant positive correlation between the proportion of Ute and poverty level among females between the ages 18 and 24 in the United States with a correlation coefficient (R) of 0.626 and weighted average of 25.4%, a difference of 21.8%.
Female Poverty Among 18-24 Year Olds Correlation Summary
| Measurement | Immigrants from Singapore | Ute |
| Minimum | 1.3% | 6.2% |
| Maximum | 55.8% | 76.1% |
| Range | 54.6% | 69.9% |
| Mean | 21.4% | 34.8% |
| Median | 19.6% | 27.1% |
| Interquartile 25% (IQ1) | 12.8% | 19.9% |
| Interquartile 75% (IQ3) | 23.7% | 52.9% |
| Interquartile Range (IQR) | 10.9% | 33.0% |
| Standard Deviation (Sample) | 13.3% | 22.4% |
| Standard Deviation (Population) | 13.2% | 21.5% |
Similar Demographics by Female Poverty Among 18-24 Year Olds
Demographics Similar to Immigrants from Singapore by Female Poverty Among 18-24 Year Olds
In terms of female poverty among 18-24 year olds, the demographic groups most similar to Immigrants from Singapore are Immigrants from Guatemala (20.9%, a difference of 0.010%), Scottish (20.9%, a difference of 0.040%), Luxembourger (20.9%, a difference of 0.040%), Immigrants from Eritrea (20.9%, a difference of 0.050%), and Israeli (20.9%, a difference of 0.060%).
| Demographics | Rating | Rank | Female Poverty Among 18-24 Year Olds |
| Immigrants | St. Vincent and the Grenadines | 6.0 /100 | #231 | Tragic 20.8% |
| Finns | 6.0 /100 | #232 | Tragic 20.8% |
| Immigrants | Denmark | 5.8 /100 | #233 | Tragic 20.8% |
| Welsh | 5.4 /100 | #234 | Tragic 20.8% |
| Immigrants | Uganda | 5.1 /100 | #235 | Tragic 20.8% |
| Okinawans | 4.9 /100 | #236 | Tragic 20.8% |
| Scottish | 4.5 /100 | #237 | Tragic 20.9% |
| Immigrants | Singapore | 4.4 /100 | #238 | Tragic 20.9% |
| Immigrants | Guatemala | 4.3 /100 | #239 | Tragic 20.9% |
| Luxembourgers | 4.2 /100 | #240 | Tragic 20.9% |
| Immigrants | Eritrea | 4.2 /100 | #241 | Tragic 20.9% |
| Israelis | 4.1 /100 | #242 | Tragic 20.9% |
| Marshallese | 3.4 /100 | #243 | Tragic 20.9% |
| Immigrants | Thailand | 3.4 /100 | #244 | Tragic 20.9% |
| Aleuts | 3.3 /100 | #245 | Tragic 20.9% |
Demographics Similar to Ute by Female Poverty Among 18-24 Year Olds
In terms of female poverty among 18-24 year olds, the demographic groups most similar to Ute are Native/Alaskan (25.4%, a difference of 0.050%), Yakama (25.3%, a difference of 0.23%), Immigrants from Saudi Arabia (25.3%, a difference of 0.48%), German Russian (25.2%, a difference of 0.91%), and Arapaho (25.2%, a difference of 0.94%).
| Demographics | Rating | Rank | Female Poverty Among 18-24 Year Olds |
| Immigrants | Congo | 0.0 /100 | #320 | Tragic 24.6% |
| Immigrants | Zaire | 0.0 /100 | #321 | Tragic 25.1% |
| Somalis | 0.0 /100 | #322 | Tragic 25.1% |
| Arapaho | 0.0 /100 | #323 | Tragic 25.2% |
| German Russians | 0.0 /100 | #324 | Tragic 25.2% |
| Immigrants | Saudi Arabia | 0.0 /100 | #325 | Tragic 25.3% |
| Yakama | 0.0 /100 | #326 | Tragic 25.3% |
| Ute | 0.0 /100 | #327 | Tragic 25.4% |
| Natives/Alaskans | 0.0 /100 | #328 | Tragic 25.4% |
| Cajuns | 0.0 /100 | #329 | Tragic 25.7% |
| Immigrants | Somalia | 0.0 /100 | #330 | Tragic 25.7% |
| Chippewa | 0.0 /100 | #331 | Tragic 25.9% |
| Houma | 0.0 /100 | #332 | Tragic 26.2% |
| Apache | 0.0 /100 | #333 | Tragic 26.3% |
| Pueblo | 0.0 /100 | #334 | Tragic 26.9% |