Thai vs Cheyenne Seniors Poverty Over the Age of 75
COMPARE
Thai
Cheyenne
Seniors Poverty Over the Age of 75
Seniors Poverty Over the Age of 75 Comparison
Thais
Cheyenne
10.9%
SENIORS POVERTY OVER THE AGE OF 75
99.4/ 100
METRIC RATING
40th/ 347
METRIC RANK
14.9%
SENIORS POVERTY OVER THE AGE OF 75
0.0/ 100
METRIC RATING
284th/ 347
METRIC RANK
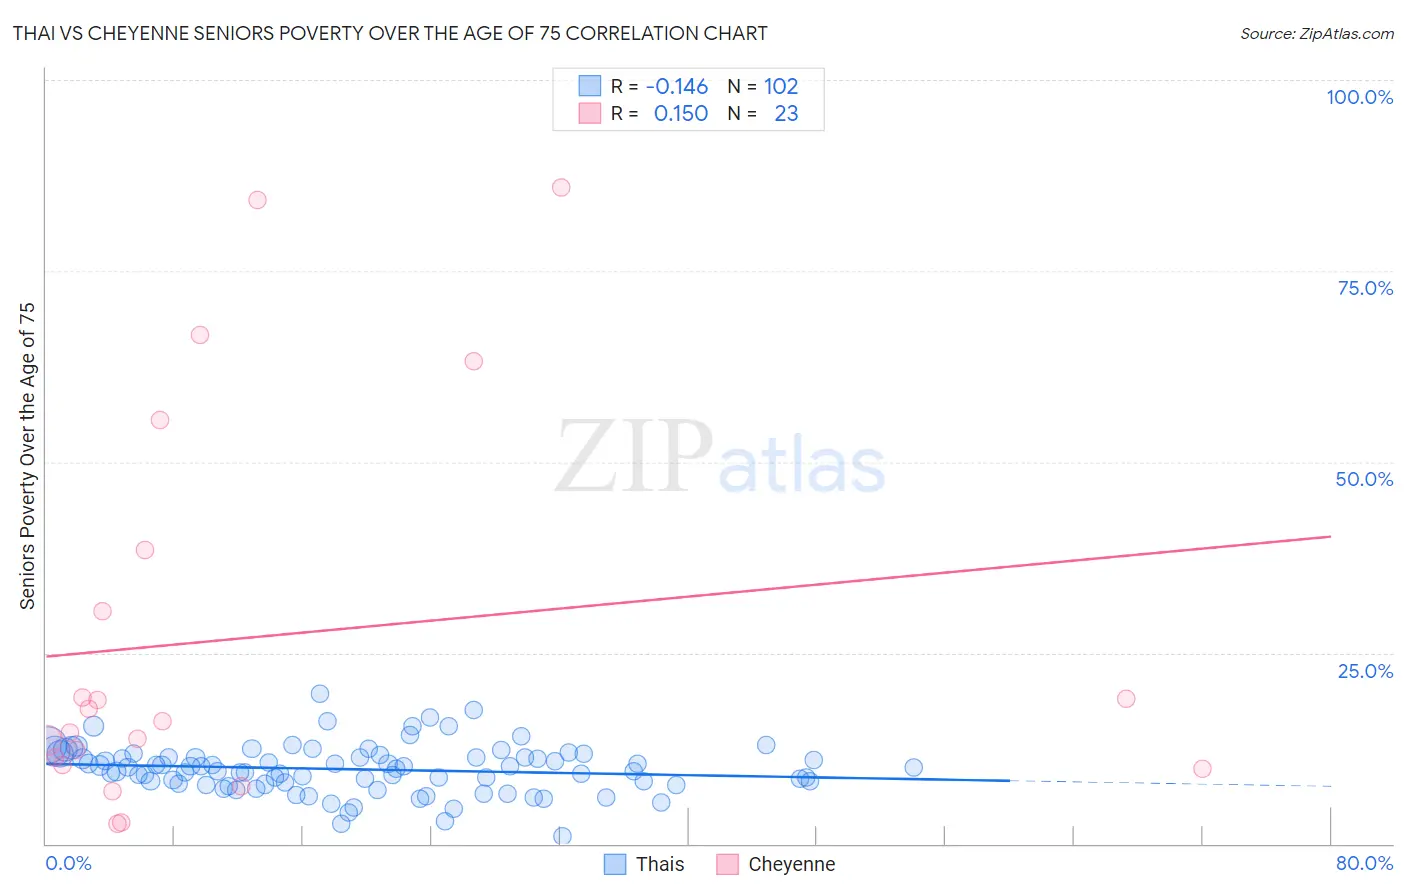
Thai vs Cheyenne Seniors Poverty Over the Age of 75 Correlation Chart
The statistical analysis conducted on geographies consisting of 468,192,905 people shows a poor negative correlation between the proportion of Thais and poverty level among seniors over the age of 75 in the United States with a correlation coefficient (R) of -0.146 and weighted average of 10.9%. Similarly, the statistical analysis conducted on geographies consisting of 80,378,238 people shows a poor positive correlation between the proportion of Cheyenne and poverty level among seniors over the age of 75 in the United States with a correlation coefficient (R) of 0.150 and weighted average of 14.9%, a difference of 36.2%.
Seniors Poverty Over the Age of 75 Correlation Summary
| Measurement | Thai | Cheyenne |
| Minimum | 0.92% | 2.7% |
| Maximum | 19.7% | 85.9% |
| Range | 18.8% | 83.2% |
| Mean | 9.7% | 27.0% |
| Median | 9.9% | 16.1% |
| Interquartile 25% (IQ1) | 7.9% | 10.3% |
| Interquartile 75% (IQ3) | 11.3% | 38.5% |
| Interquartile Range (IQR) | 3.4% | 28.2% |
| Standard Deviation (Sample) | 3.1% | 25.7% |
| Standard Deviation (Population) | 3.1% | 25.1% |
Similar Demographics by Seniors Poverty Over the Age of 75
Demographics Similar to Thais by Seniors Poverty Over the Age of 75
In terms of seniors poverty over the age of 75, the demographic groups most similar to Thais are Czechoslovakian (10.9%, a difference of 0.22%), Immigrants from Lithuania (11.0%, a difference of 0.49%), Austrian (11.0%, a difference of 0.76%), Celtic (11.0%, a difference of 0.81%), and Finnish (10.8%, a difference of 0.84%).
| Demographics | Rating | Rank | Seniors Poverty Over the Age of 75 |
| Puget Sound Salish | 99.7 /100 | #33 | Exceptional 10.8% |
| Italians | 99.7 /100 | #34 | Exceptional 10.8% |
| Luxembourgers | 99.6 /100 | #35 | Exceptional 10.8% |
| Scotch-Irish | 99.6 /100 | #36 | Exceptional 10.8% |
| Latvians | 99.6 /100 | #37 | Exceptional 10.8% |
| Finns | 99.6 /100 | #38 | Exceptional 10.8% |
| Czechoslovakians | 99.4 /100 | #39 | Exceptional 10.9% |
| Thais | 99.4 /100 | #40 | Exceptional 10.9% |
| Immigrants | Lithuania | 99.2 /100 | #41 | Exceptional 11.0% |
| Austrians | 99.1 /100 | #42 | Exceptional 11.0% |
| Celtics | 99.1 /100 | #43 | Exceptional 11.0% |
| Belgians | 99.1 /100 | #44 | Exceptional 11.0% |
| Carpatho Rusyns | 99.0 /100 | #45 | Exceptional 11.1% |
| Greeks | 99.0 /100 | #46 | Exceptional 11.1% |
| Hawaiians | 98.8 /100 | #47 | Exceptional 11.1% |
Demographics Similar to Cheyenne by Seniors Poverty Over the Age of 75
In terms of seniors poverty over the age of 75, the demographic groups most similar to Cheyenne are Immigrants from Mexico (14.9%, a difference of 0.19%), Immigrants from Central America (15.0%, a difference of 0.53%), Guatemalan (14.8%, a difference of 0.64%), Immigrants from Senegal (14.8%, a difference of 0.70%), and Belizean (14.8%, a difference of 0.88%).
| Demographics | Rating | Rank | Seniors Poverty Over the Age of 75 |
| Senegalese | 0.0 /100 | #277 | Tragic 14.5% |
| Immigrants | Colombia | 0.0 /100 | #278 | Tragic 14.6% |
| Blacks/African Americans | 0.0 /100 | #279 | Tragic 14.6% |
| Central Americans | 0.0 /100 | #280 | Tragic 14.7% |
| Belizeans | 0.0 /100 | #281 | Tragic 14.8% |
| Immigrants | Senegal | 0.0 /100 | #282 | Tragic 14.8% |
| Guatemalans | 0.0 /100 | #283 | Tragic 14.8% |
| Cheyenne | 0.0 /100 | #284 | Tragic 14.9% |
| Immigrants | Mexico | 0.0 /100 | #285 | Tragic 14.9% |
| Immigrants | Central America | 0.0 /100 | #286 | Tragic 15.0% |
| Immigrants | Guatemala | 0.0 /100 | #287 | Tragic 15.1% |
| Jamaicans | 0.0 /100 | #288 | Tragic 15.1% |
| Immigrants | Belize | 0.0 /100 | #289 | Tragic 15.2% |
| Immigrants | Azores | 0.0 /100 | #290 | Tragic 15.2% |
| Paiute | 0.0 /100 | #291 | Tragic 15.2% |